Fig. 2.
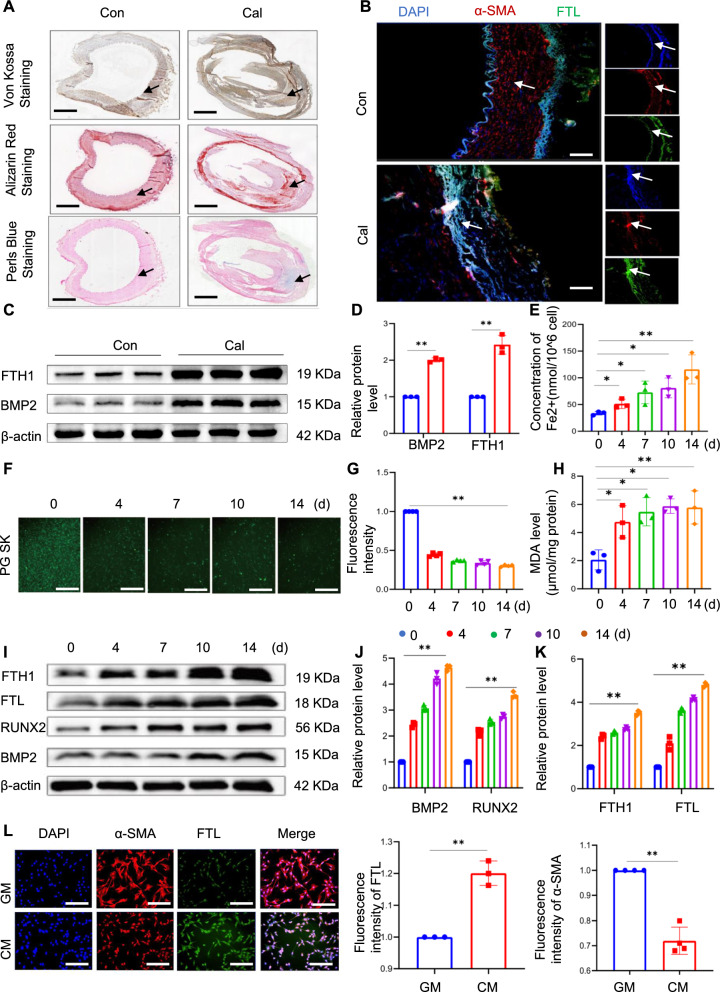
Iron overload is induced during calcium/phosphate-induced vascular calcification. Arterial specimens were obtained from the amputated patients. Artery tissue sections were cut into 5 µm thick sections. Calcification was initially confirmed through alizarin red staining and Von Kossa staining, while Perl's blue staining was employed to detect iron within the calcification area; black arrow head indicates the medial layer of artery. Scale bar: 1.25 mm (A). The expression of smooth muscle actin (SMA) and ferritin light chain (FTL) in human arterial samples was assessed using immunofluorescence; white arrow head indicates the medial layer of artery. Scale bar: 20 µm (B). Total aortic proteins were extracted and the expression of BMP2 and FTH1 was determined by western blot analysis. *P < 0.05, **P < 0.01 (C and D). MAoSMCs were treated with calcifying medium (CM) for 0, 4, 7, 10, and 14 days. The intracellular iron levels (nmol/ 106 cells) were measured using an iron assay kit (E). Phen Green SK was used to evaluate intracellular Fe.2+. Scale bar: 50 µm (F). Malondialdehyde (MDA) levels were assessed (H). Western blot analysis of osteogenic marker proteins (Runx2 and BMP2) and iron storage proteins (FTH1 and FTL) is presented in (I‒K). The expression levels of α-SMA and FTL in VSMCs of indicated groups were determined by immunofluorescence staining (n = 4). Scale bar: 50 µm (L)

