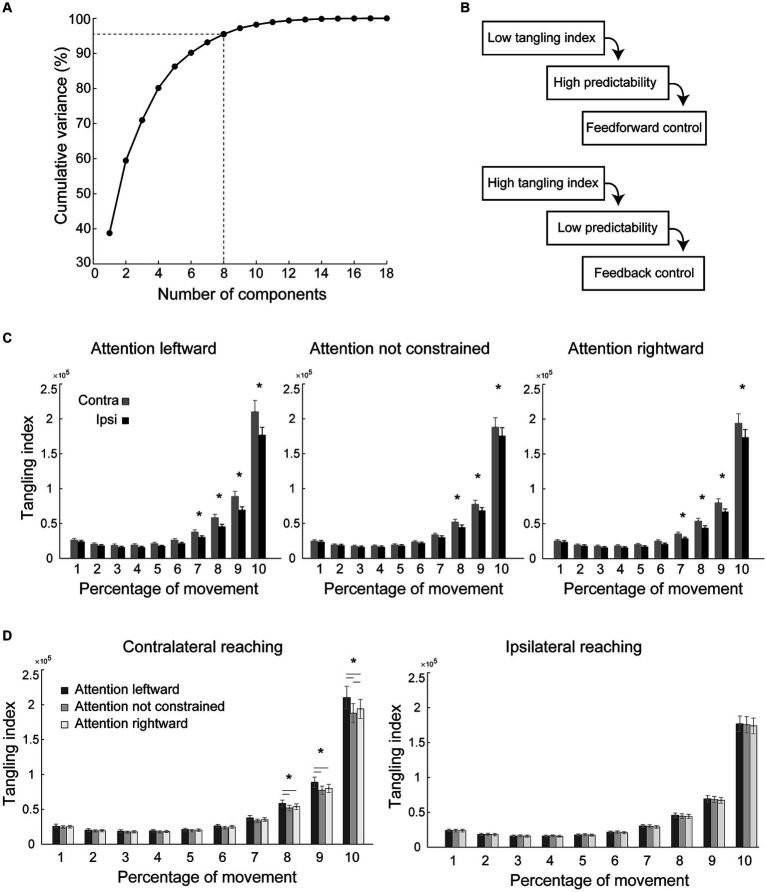
Figure 4.
Principal component analysis and tangling index. (A) Principal component analysis: proportion of variance explained by the principal components. With 8 principal components more than 95% of the variance is explained. (B) Influence of unexpected inputs measured on behavioral trajectories. Tangling index quantifies the regime of a dynamical system (low tangling: feedforward dynamics; high tangling: feedback-driven dynamics). (C,D) Analysis of tangling index: effects of the Time bin by Reaching side by Side of attention interaction on the tangling index, indicative of a different motor control during contralateral compared to during ipsilateral reaching (C) and, during contralateral reaching, when attention was directed leftward compared to when attention was directed rightward, or when it was not constrained (D). Tangling indexes were divided into 10 time-bins, each comprising 10% of the movement time. Other conventions as in Figures 2, 3.

