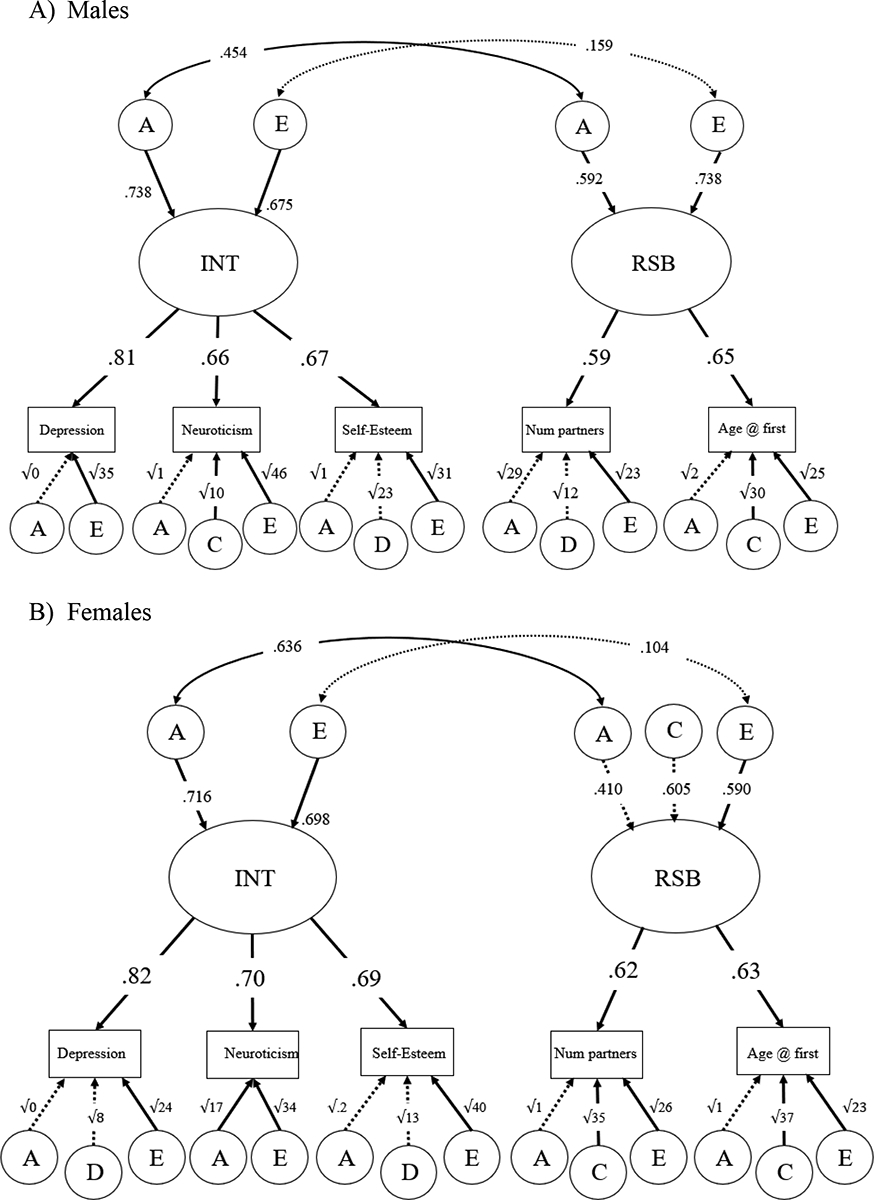
Figure 2.

Five-group sex-limitation, with genetic and nonshared environmental correlations.
Panel A) Males. Panel B) Females. Standardized estimates given. Significant paths shown with solid arrows; non-significant paths shown with dotted arrows. Residual A, C, D, and E influences path coefficients are written as the square root of the variances. Fit: χ2(273) = 283.589, p = .3171, RMSEA = 0.012, CFI = 0.996, AIC = 11941.006.
