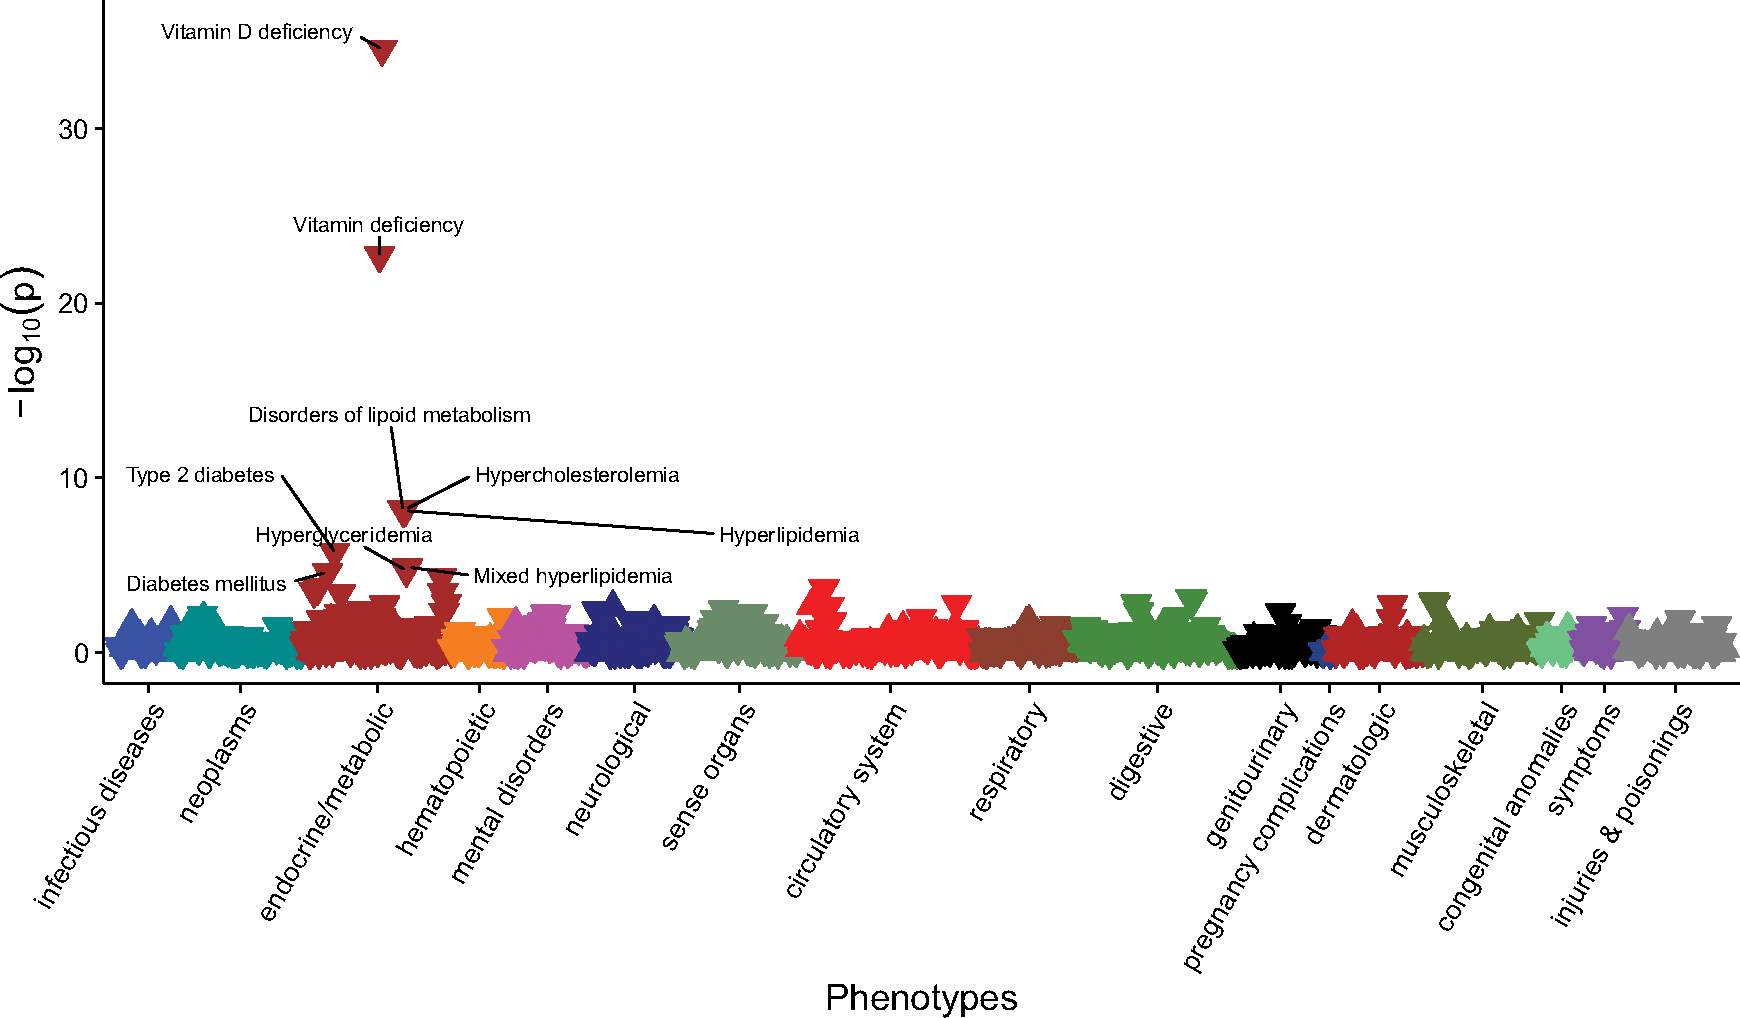
Figure 1.

The association between PGS25OHD and disease phenotypes in individuals with primarily European ancestry (n = 66,482).
Note: Associations for 1322 phenotypes are shown. On the x-axis, the phenotypes clustered according to broad phenotype categories represented by different colors. P values are shown on the y-axis, with upturned triangles representing positive associations and downturned triangles representing negative associations. The top phenotypes with p values exceeding the Bonferroni multiple testing threshold (p < 3.78e-5), are labeled. Full details are provided in Supplementary data 1.
