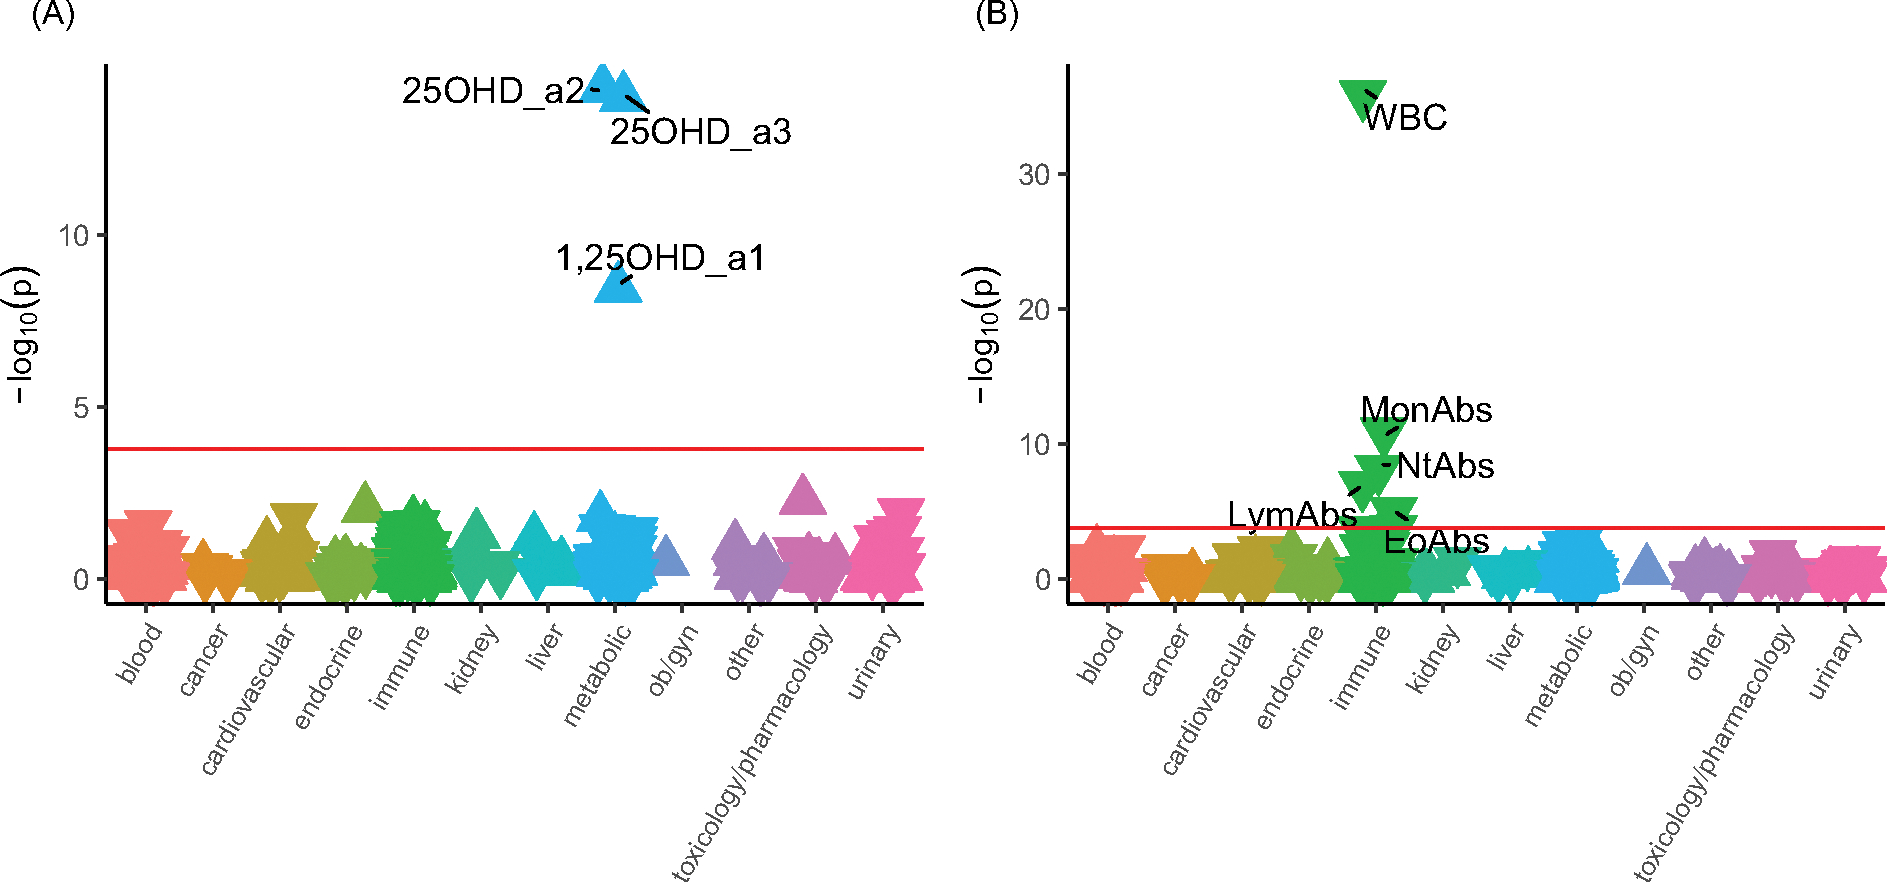
Figure 4.

The associations between PGSDBP, PGSDBP_GC and laboratory measures in individuals with primarily European ancestry (n = 66,482).
Note: Panel A, LabWAS for PGSDBP. Panel B, LabWAS for PGSDBP_GC. Associations for 315 laboratory results are shown. On the x-axis, the laboratory tests are clustered according to broad organ or pathology categories, represented by different colors. P values are shown on the y-axis, with upturned triangles representing positive associations and downturned triangles representing negative associations. Laboratory tests with p values exceeding the Bonferroni multiple testing threshold (p < 1.59e-04), shown as a pink horizontal reference line, are labeled. 25OHD_a2 and 25OHD_a3 are two different types of 25 hydroxyvitamin D assays. 1,25OHD_a1 and 1,25OHD_a4 are two different types of 1,25 dihydroxyvitamin D assays (see Methods). WBC, leukocytes (#/volume) in blood by automated count. LymAbs, lymphocytes (#/volume) in blood by automated count. MonAbs, absolute count of monocytes. NtAb, absolute count of neutrophils. EoAb, absolute count of eosinophils. Full details are provided in Supplementary data 4 and 6.
