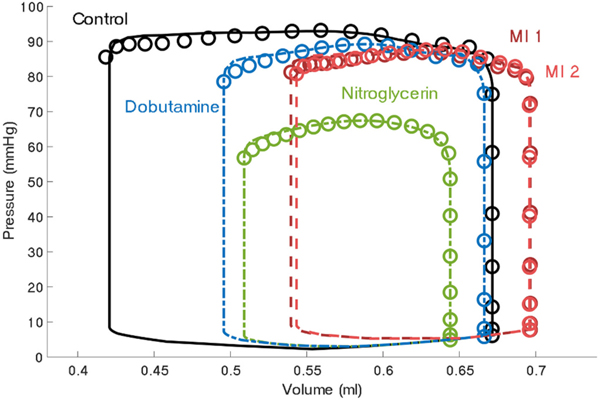
Fig. 2.
Total left ventricle pressure-volume behavior of a representative rat prior to infarction (Time Point 1: Control), following infarction (Time Point 2: MI 1), after nitroglycerin administration (Time Point 3), after drug clearance (Time Point 4: MI 2), and after dobutamine administration (Time Point 5). Data is shown by circles and model fits are shown by solid (Control), dashed (MI 1 or MI 2), or dot-dashed (pharmacologic perturbations) lines.

