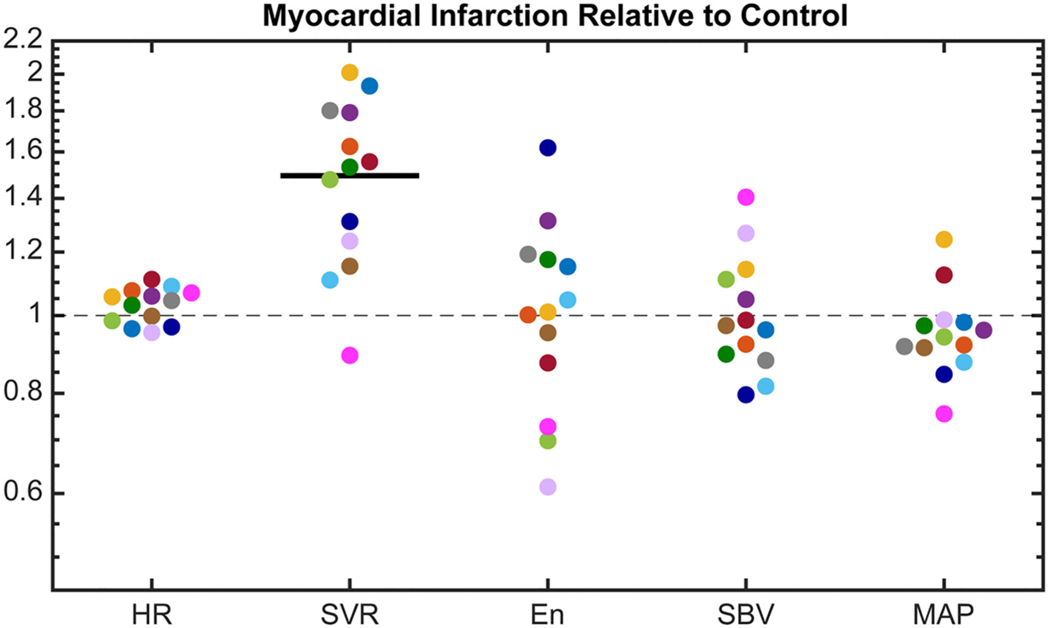
Fig. 3.
Compensatory mechanisms following myocardial infarction, including: measured heart rate (), computed systemic vascular resistance (), fitted end-systolic elastance of non-infarcted region , and fitted stressed blood volume (). Each rat’s response is shown in a different color (n = 13). The change in computed mean arterial pressure () is also shown. No change is indicated by the gray dashed line and a significant mean change for all animals is indicated by a dark solid line (p < 0.05). Paired parametric t-tests were performed on all metrics except , which failed the normality test and was analyzed with a Wilcoxon matched-pairs signed rank test.

