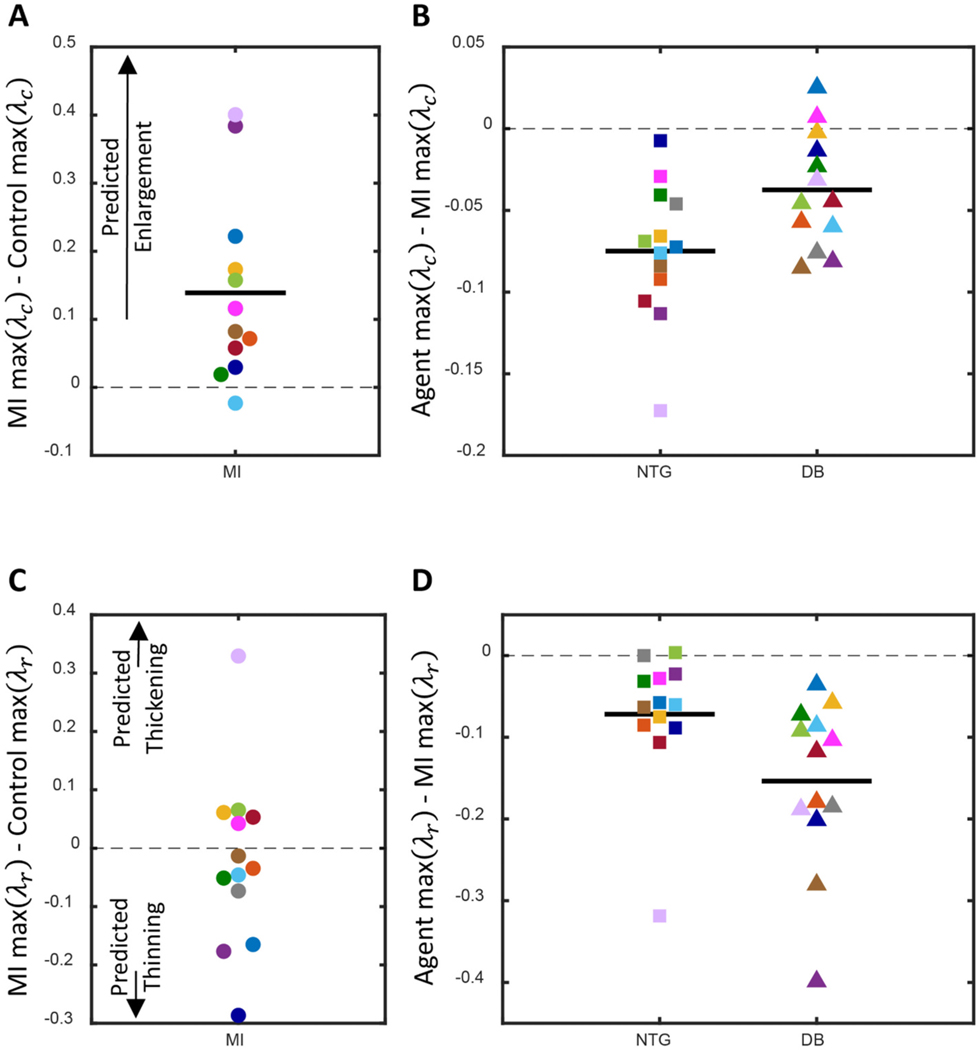
Fig. 7.
(A) The difference in peak circumferential stretch, , following myocardial infarction (MI). Increased peak was associated with more ventricular enlargement in prior studies [21,25]. (B) The difference in postinfarction peak with administration of a pharmacologic agent, either nitroglycerin (NG) or dobutamine (DB). (C) Difference in peak radial stretch, , following MI. Increased peak was indicative of ventricular thickening and decreased peak was indicative of ventricular thinning in prior studies. (D) The difference in postinfarction peak with administration of NG or DB. In all plots no change is indicated by the gray dashed line and a significant average difference is indicated by a dark solid line (p < 0.05). Paired parametric t-tests were performed for all analyses since peak stretches were both normally distributed at all time points. Each rat’s response is shown in a different color.

