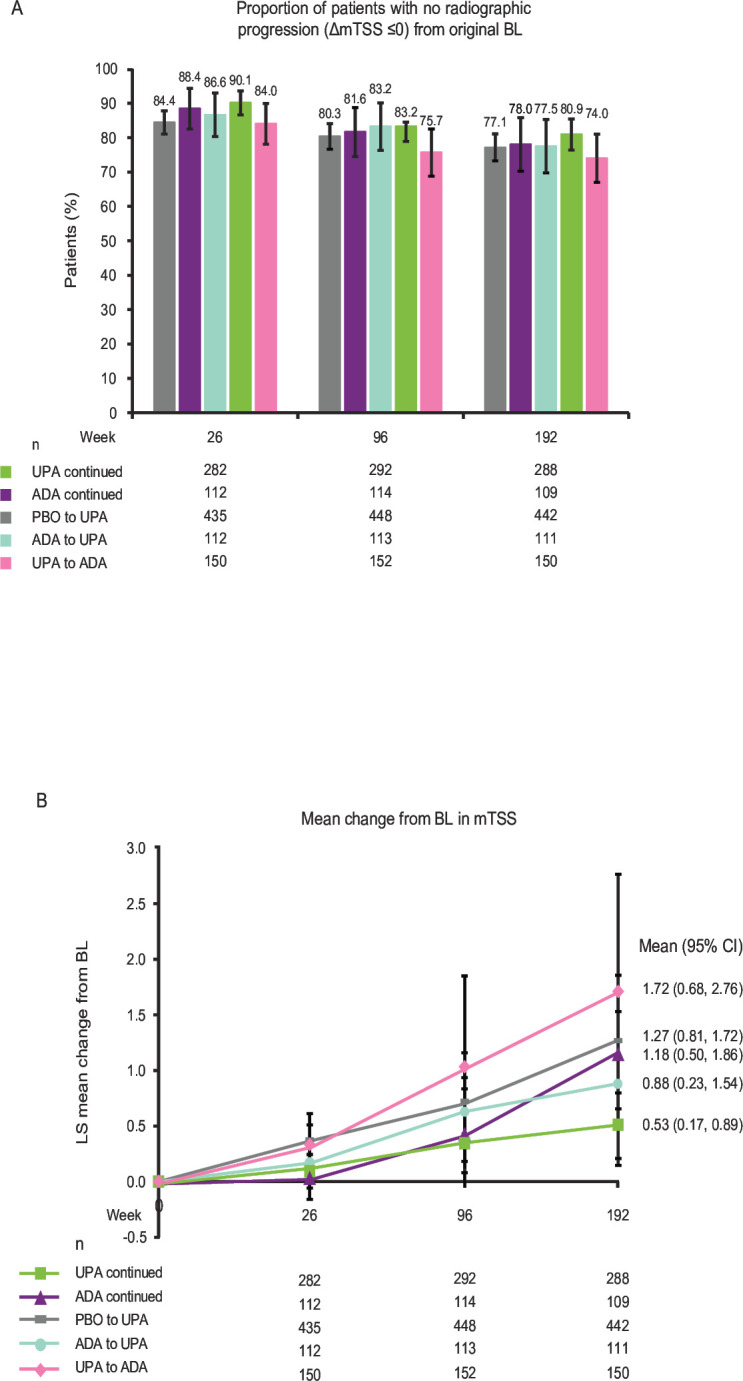
Figure 5.

Radiographic outcomes at 26, 96 and 192 weeks (AO). Groups are by treatment sequence AO, without imputation for missing data. All patients in the PBO group who were not previously rescued were switched to UPA at week 26. Data points plotted here are shown inonline supplemental tables 9,10. Δ, change from baseline; ADA, adalimumab; AO, as observed; BL, baseline; LS, least squares; PBO, placebo; mTSS, modified Total Sharp Score; UPA, upadacitinib.
