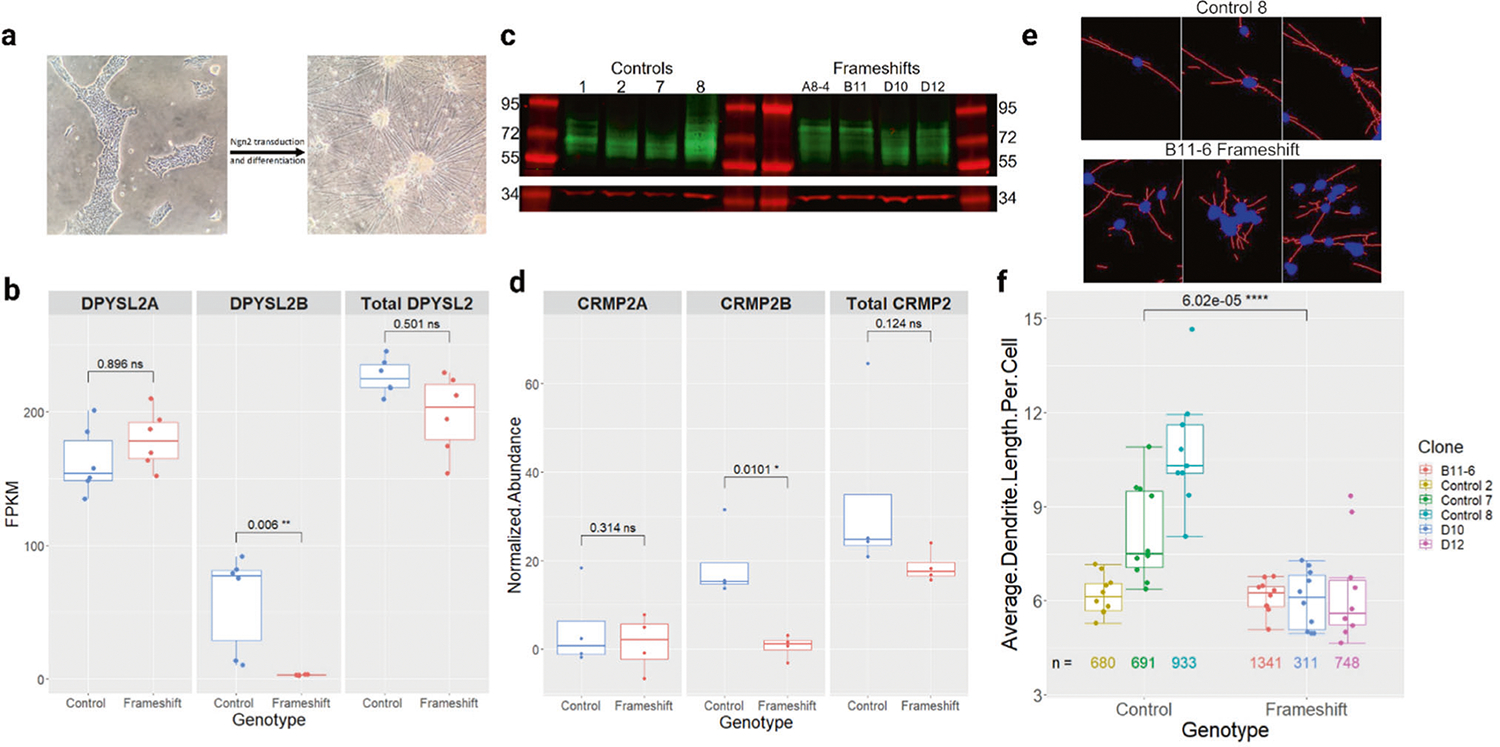
Fig. 2. Generation and characterization of DPYSL2-B frameshift glutamatergic neurons.

a Representative images of iPSCs before and after Ngn2-induced neuronal differentiation. Scale bars = 1 mm. b Quantification of RNA-seq data showing significantly reduced expression of DPYSL2-B in frameshift (n = 6) neuron clones compared to controls (n = 6) (padj = 0.006, Wald test with Benjamini and Hochberg adjustment). DPYSL2-A expression was not significantly changed, and all other DPYSL2 isoforms were not expressed. c Western blot comparing CRMP2-B (64–72 kD, green) and CRMP2A (72–80 kD, green) abundance in control (n = 5) and frameshift (n = 4) neuron clones with GAPDH ( ~ 37 kD, red) as a loading control. The multiple bands were interpreted to represent post-translational modifications. See the methods section for more detail on isoform distinction. d Quantification of (c). CRMP2-B was significantly reduced in the frameshift clones (p = 0.01, t-test), but CRMP2-A and the total amount of CRMP2 were not changed. Data were normalized to GAPDH. e Representative images of control and frameshift neurons after Neurphology J analysis with soma in blue and dendrites in red. Each image is cropped from the full-size pictures in Supplementary Fig. 1. Scale bars = 1 mm. f Quantification of the average dendrite length per cell in frameshift (n = 3) and control (n = 3) neuron clones. Each dot represents data from one image, with 9–10 images analyzed per clone. The numbers under each boxplot represent the total number of cells that were analyzed for that clone across all the images. The average length of dendrites per cell was significantly reduced in the frameshift clones (p = 6.02 × 10^−5, t-test).
