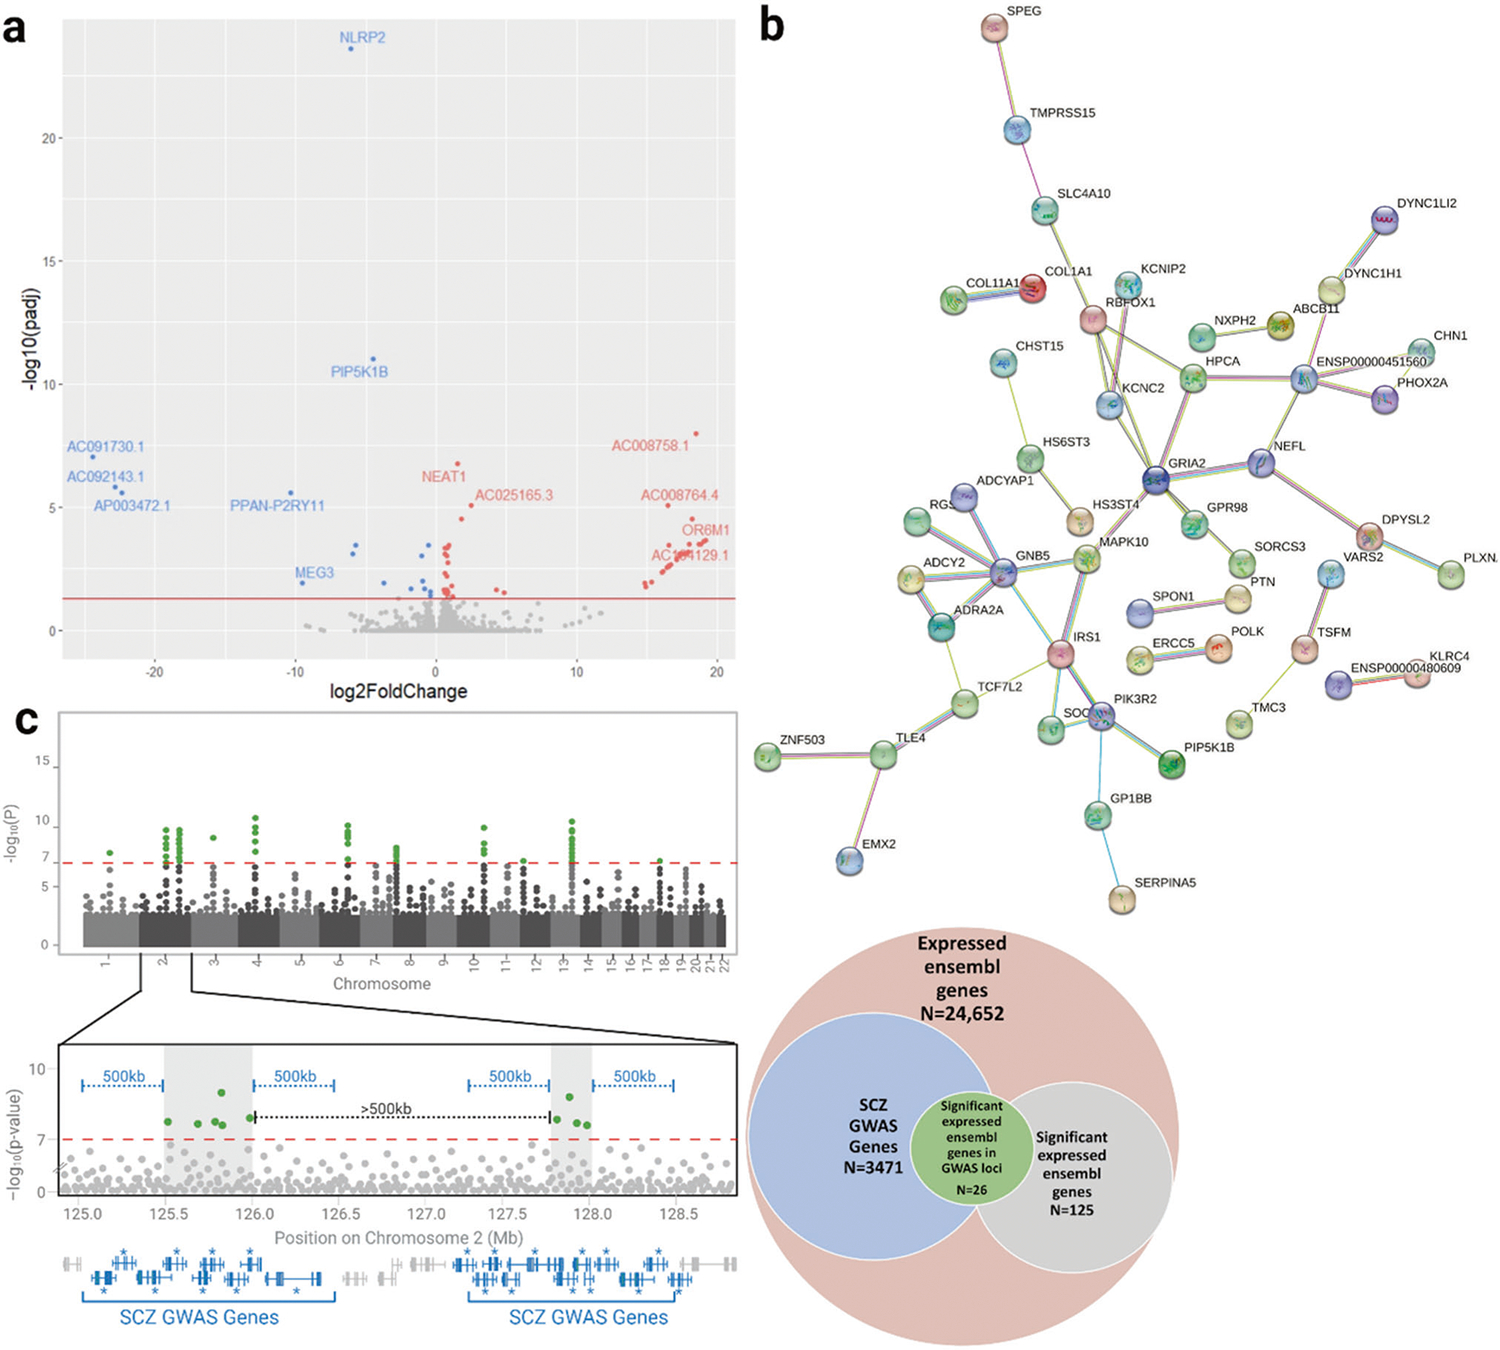
Fig. 3. Transcriptomic analysis of DPYSL2-B frameshift neurons.

a Volcano plot depicting differential gene expression of the frameshift and control neurons based on DESeq2 analysis of RNA-seq data. The red line indicates genome-wide significance of padj < 0.05. Genes significantly upregulated in the frameshift neurons are in red and downregulated genes are in blue. b Schematic of theoretical GWAS data demonstrating the workflow used to identify genes in schizophrenia risk loci (“SCZ GWAS genes”) from the largest schizophrenia GWAS to date [42]. SNPs reaching significance of 1 × 10⁻⁷ (green) were clustered into linkage disequilibrium blocks (gray shaded boxes) at least 500 kb apart. Any genes within 500 kb of these blocks (blue) were considered SCZ GWAS genes. Of the 24,652 genes expressed in the Ngn2-induced neurons, 3471 were GWAS genes. Of the 125 genes that were present in the UCSC gene list and were significant with padj < 0.2 via DESeq2, 26 were GWAS genes. This represents a significant enrichment of our differentially expressed genes in schizophrenia risk loci (p = 0.03, chi squared test). c STRING network demonstrating significant enrichment of protein-protein interactions amongst DPYSL2 and the 132 differentially expressed genes with padj < 0.2. Of the 132 genes, 96 had protein products and 37 of these proteins interacted, representing a 1.77 x enrichment (p = 0.012, see methods for details on statistical analysis).
