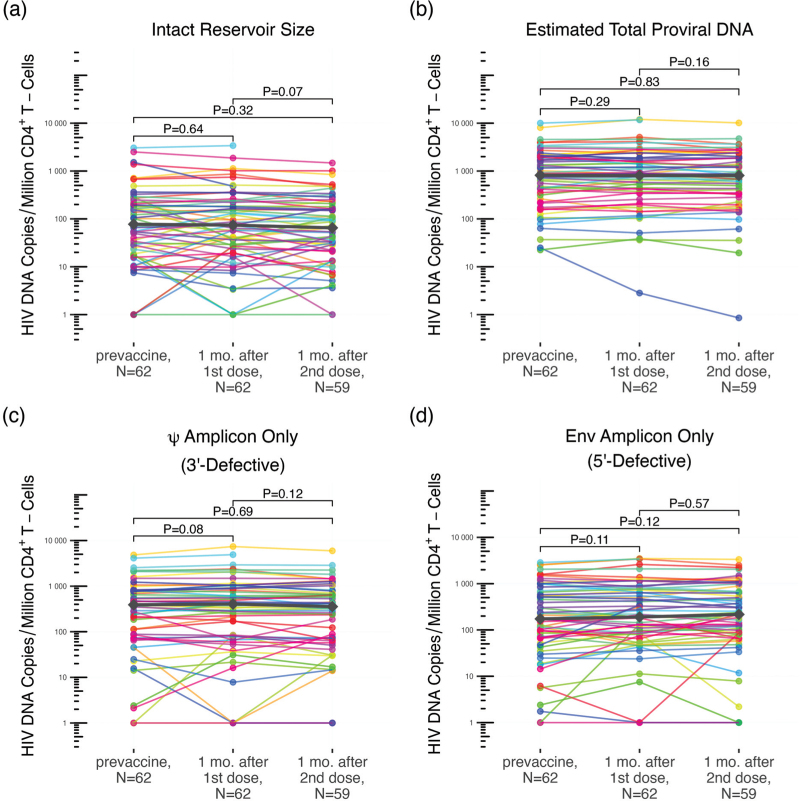
Fig. 2.
Measures of intact reservoir size, and total, 5’-defective, 3’-defective proviral burdens after one- and two-dose COVID-19 vaccination.
Intact reservoir size (panel a), total proviral burden (panel b), 3’-defective proviral burden (panel c), and 5’-defective proviral burden (panel d) measured at baseline (prevaccine), one month after the first vaccine dose, and one month after the second vaccine dose, using the intact proviral DNA assay (IPDA). Each participant is identified by a unique color that is consistent throughout all figures. Median values at each time point are depicted as grey diamonds. P-values were calculated using the Wilcoxon signed-rank test for paired data. COVID-19, coronavirus disease 2019.

