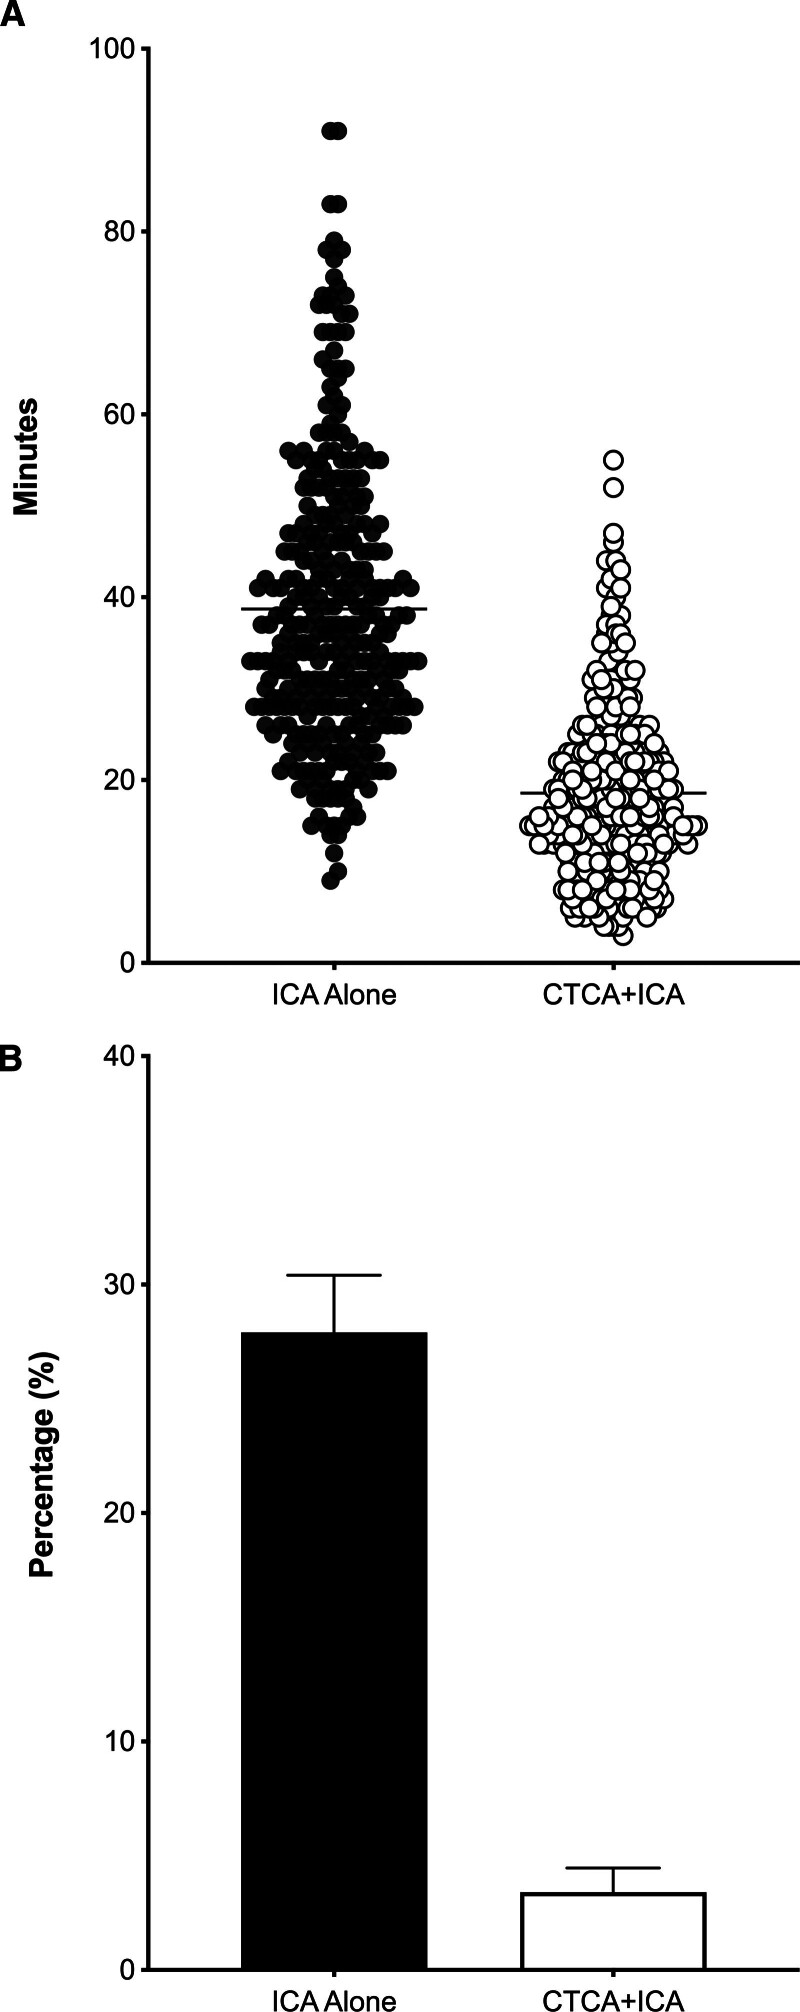
Figure 2.
Procedural duration and incidence of contrast-induced nephropathy. A, Violin plot of the procedural duration of invasive coronary angiography (ICA) for the 2 groups. Mean and SD are shown behind the scatterplots. B, Contrast-induced nephropathy incidence in both the treatment groups. CTCA indicates computed tomography cardiac angiography.

