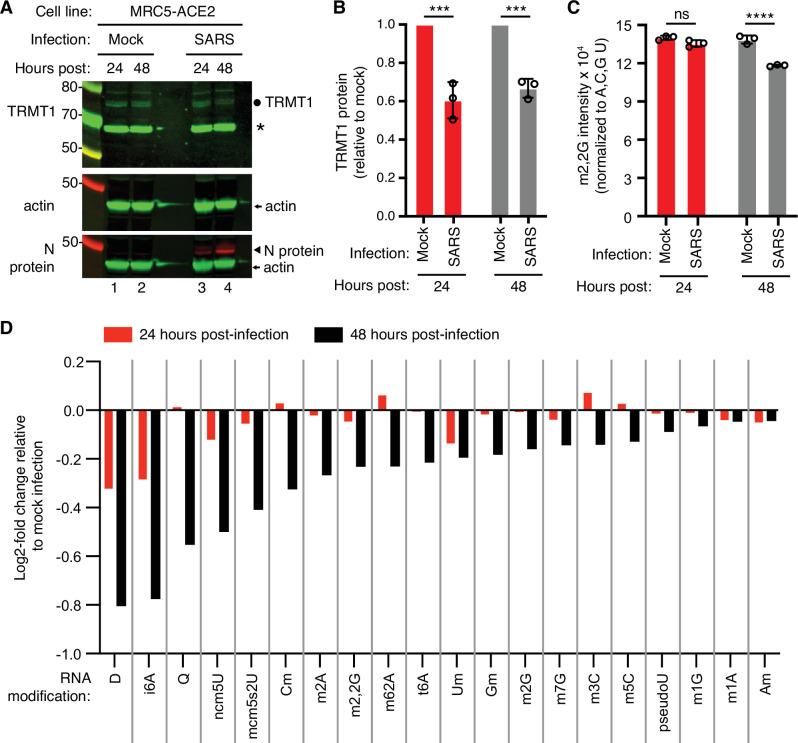
Figure 1. Human cells infected with severe acute respiratory syndrome coronavirus 2 (SARS-CoV-2) exhibit a reduction in tRNA methyltransferase 1 (TRMT1) levels and perturbations in tRNA modification patterns.
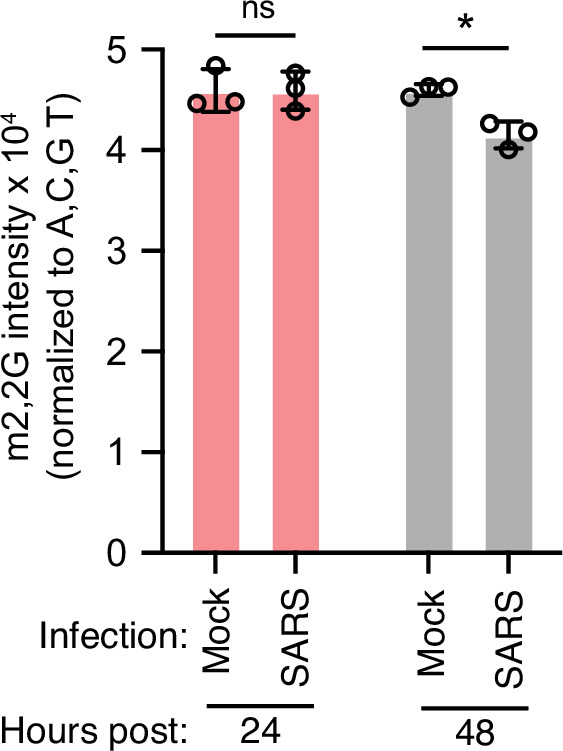
(A) Immunoblot analysis of lysates prepared from MRC-5-ACE2 human cells that were mock-infected or infected with SARS-CoV-2 at multiplicity of infection (MOI) of 5 for 24 or 48 hr. The immunoblot was probed with anti-TRMT1, actin, or SARS-CoV-2 nucleocapsid (N) antibodies. Circle represents endogenous full-length TRMT1. Asterisk (*) denotes a non-specific band. Size markers are noted in kiloDalton. (B) Quantification of TRMT1 signal intensity normalized to actin in the mock or SARS-CoV-2-infected cell lines. TRMT1 protein levels are expressed relative to mock-infected samples for each time point. (C) m2,2G levels in small RNAs isolated from MRC5 cells that were either mock-infected or infected with SARS-CoV-2 at MOI of 5 for 24 or 48 hr. m2,2G levels were normalized to A, C, G, and U. Samples were measured in biological replicates. Statistical significance for (B) and (C) was determined by two-way ANOVA with multiple comparisons test. ***p<0.001; ****p<0.0001; ns, non-significant. (D) Levels of the indicated RNA modifications in small RNAs isolated from MRC5 cells that were either mock-infected or infected with SARS-CoV-2 for 24 or 48 hr. RNA modification levels were normalized to A, C, G, and U. Y-axis represents the log2 fold change in the levels of the indicated tRNA modification between SARS-CoV-2 infected versus mock-infected MRC5 cells. The experiment in (C) was repeated as an independent biological replicate in Figure 1—figure supplement 1.
Figure 1—figure supplement 1. LC-MS analysis of dimethylguanosine (m2,2G) levels in small RNAs isolated from MRC5 cells that were either mock-infected or infected with severe acute respiratory syndrome coronavirus 2 (SARS-CoV-2) at multiplicity of infection (MOI) of 5 for 24 or 48 hr.


