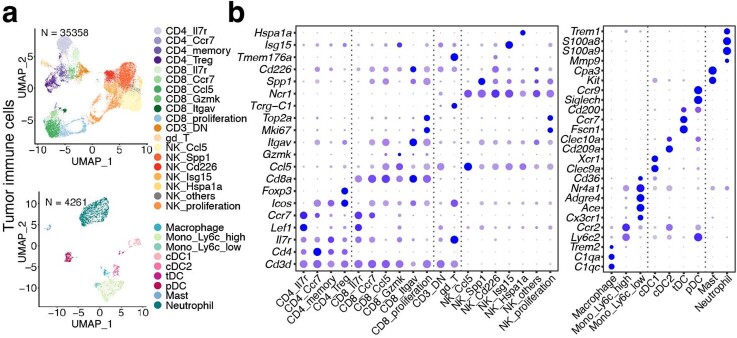
Extended Data Fig. 6. Annotation of single cells collected from mouse tumours.
Single cell RNA-seq was performed on intratumoural CD45+ cells isolated from tumours at day 3 after treatment, and data are from one independent experiment with n = 5 mice in each group. This is related to Fig. 4b–d. a, UMAP of tumour-infiltrating lymphocytes (top, n = 35,358) and myeloid (bottom, n = 4,261) cells coloured by cell types. b, Bubble plots showing marker gene expression for T and NK cells (left) and myeloid cells (right) as shown in (a).

