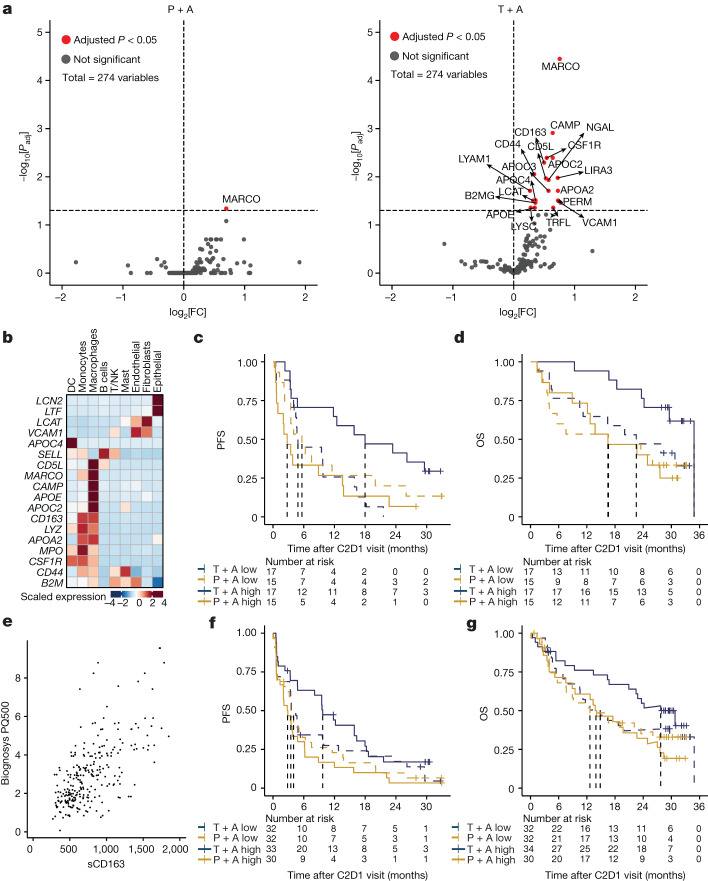
Fig. 2. Treatment with tiragolumab plus atezolizumab leads to increased serum myeloid proteins.
a, Differential abundance analysis of serum proteins at C2D1 relative to the baseline in patients who were treated with placebo + atezolizumab (left) or tiragolumab + atezolizumab (right). Statistical analysis was performed using limma with Benjamini–Hochberg correction. FC, fold change; Padj, adjusted P. b, The gene expression profiles of the significantly increased proteins in a based on a public NSCLC scRNA-seq dataset, suggesting a myeloid cell origin for most of these proteins, including NGAL (LCN2), TRFL (LTF), LCAT, VCAM1, APOC4, LYAM1 (SELL), CD5L, MARCO, CAMP, APOE, APOC2, CD163, LYSC (LYZ), APOA2, PERM (MPO), CSF-1R, CD44, B2MG (B2M); for protein–gene pairs that have distinct names, the gene names are shown in parentheses in italics. c,d, Kaplan–Meier curves of PFS (c) and OS (d) in patients with low (dashed lines) or high (solid lines) levels of serum myeloid proteins at C2D1 relative to C1D1 using a composite of significantly increased myeloid proteins (MARCO, CAMP, CD163, CSF-1R, CD5L, NGAL (LCN2), GAPR1, APOC1, APOC2, APOC3 and APOC4), as determined by the median composite score cut-off. e, The correlation between sCD163 levels by ELISA and CD163 detected by mass spectrometry. n = 266. Statistical analysis was performed using two-tailed Pearson correlation; r = 0.657, P < 2.2 × 10⁻¹⁶. f,g, Kaplan–Meier curves of the PFS (f) and OS (g) in patients with a low (dashed lines) and high (solid lines) fold change in sCD163 at C2D1 relative to C1D1, as determined by the median fold-change cut-off. For c,d,f,g, HRs and 95% CIs were determined using a univariate Cox model. DCs, dendritic cells.

