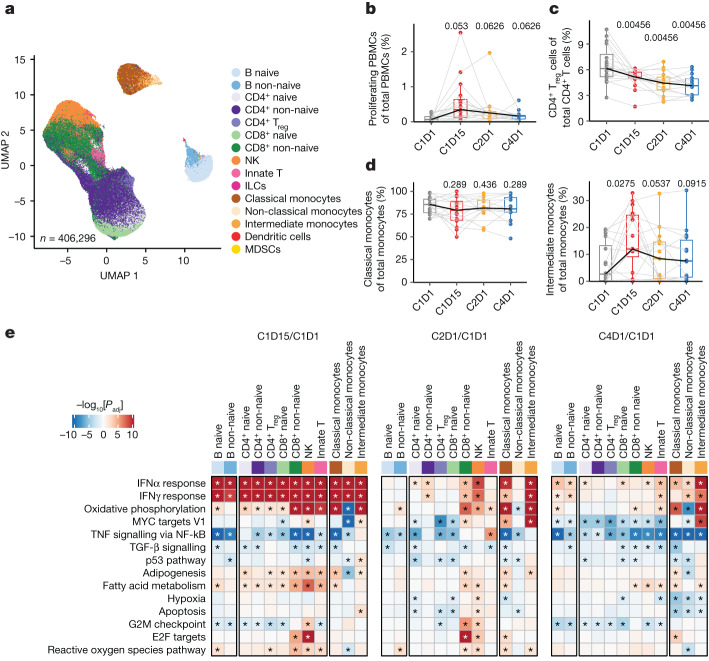
Fig. 3. Tiragolumab plus atezolizumab leads to T, NK and myeloid cell activation in PBMCs.
a, Uniform manifold approximation and projection (UMAP) analysis of PBMC single cells coloured by cell types. n = 406,296. b, The proportion of proliferating cells in PBMCs over different timepoints. n = 16. c, The proportion of Treg cells out of total CD4+ T cells over different timepoints. n = 16. d, The proportion of classical monocytes (left) and intermediate monocytes (right) out of total monocytes over different timepoints. n = 16. e, Pathway enrichment in PBMC samples obtained on-treatment compared with those obtained at the baseline across multiple immune cell types from patients with NSCLC. n = 16. Enrichment in on-treatment (red) and baseline (blue) samples is indicated. P values were calculated using nonparametric permutation tests; the asterisks represent false-discovery rate < 0.05. For the box plots in b–d, the centre line shows the median, the box limits show the interquartile range (IQR; the range between the 25th and 75th percentile) and the whiskers show 1.58 × IQR. Median values per timepoint are connected by solid black lines; samples from the same patient are connected by grey lines. P values were calculated using two-tailed paired Student’s t-tests and adjusted using the Benjamini–Hochberg procedure. ILCs, innate lymphoid cells; MDSCs, myeloid-derived suppressor cells.

