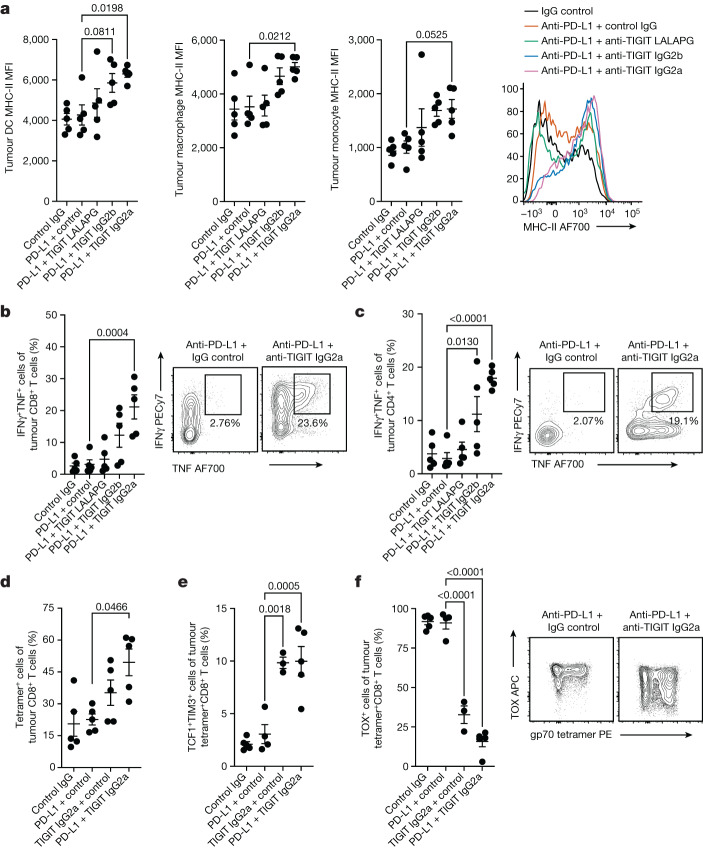
Fig. 5. Flow cytometry analysis of anti-TIGIT antibody activity on tumour myeloid cells and lymphocytes.
a, The mean fluorescence intensity (MFI) of cell surface MHC-II on tumour-infiltrating dendritic cells (left), macrophages (left middle) and monocytes (right middle). Right, histogram of representative surface MHC-II expression on tumour monocytes after various treatments. b, IFNγ and TNF co-expression in tumour-infiltrating CD8+ T cells after ex vivo stimulation (left). Right, representative fluorescence-activated cell sorting (FACS) analysis of tumour CD8+ T cell cytokine production after treatment with anti-PD-L1 monotherapy or anti-PD-L1 + anti-TIGIT IgG2a. c, IFNγ and TNF co-expression in tumour-infiltrating CD4+ T cells after ex vivo stimulation (left). Right, representative FACS analysis of CD4+ T cell cytokine production after treatment with anti-PD-L1 monotherapy or anti-PD-L1 + anti-TIGIT IgG2a. d, The frequency of gp70-tetramer-binding tumour CD8+ T cells. e, The frequencies of memory-like TCF1+TIM3+ gp70-tetramer-binding tumour CD8+ T cells. f, The frequencies of TOX+ gp70-tetramer-binding tumour CD8+ T cells (left). Right, representative FACS plots of tumour CD8+ T cell TOX expression and gp70 tetramer binding after treatment with anti-PD-L1 monotherapy or anti-PD-L1 + anti-TIGIT IgG2a. Intratumoural CD45+ cells were analysed using flow cytometry at day 3 after treatment (a–c) and gp70-tetramer-positive T cells at day 7 after treatment (d–f). Data are representative of one (a–c) or two (d–f) independent experiments with n = 5 mice in each group. For a–f, data are mean ± s.e.m. Statistical analysis was performed using one-way analysis of variance (ANOVA) with Dunnett’s multiple-comparison test, with the anti-PD-L1 monotherapy group designated as the control group.

