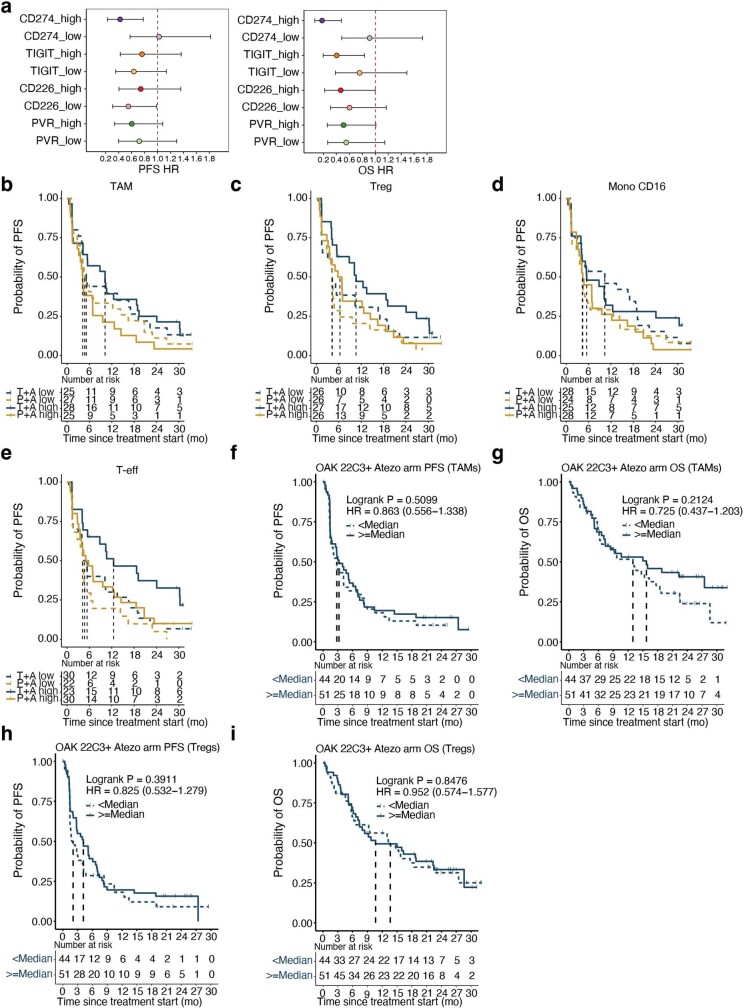
Extended Data Fig. 1. Intratumoural myeloid and Treg cell content correlates with tiragolumab plus atezolizumab outcome but not placebo plus atezolizumab.
a, Forest plot comparing tiragolumab plus atezolizumab versus placebo plus atezolizumab in patients with tumours expressing high or low gene levels (cutoff by median expression) of CD274, TIGIT, CD226, and PVR in CITYSCAPE. Hazard ratio and 95% confidence interval were determined using univariate Cox model. The dots represent the hazard ratio and the horizontal bars the 95% confidence interval. b–e, Kaplan–Meier curves comparing PFS in patients with tumours enriched (solid lines) or not enriched (dashed lines) for TAMs (b), Tregs (c), CD16-high monocytes (d), and CD8 + T effector cells (T-eff) (e). Enrichment or not was determined by the median cell type signature score cutoffs. f, g, Kaplan–Meier curves comparing the PFS (f) and OS (g) in PD-L1-positive patients from the phase 3 NSCLC OAK study who received atezolizumab monotherapy and had tumours enriched for TAMs. h, i, Kaplan–Meier curves comparing the PFS (h) and OS (i) in PD-L1-positive patients from the phase 3 NSCLC OAK study who received atezolizumab monotherapy and had tumours enriched for Tregs. f-i, Hazard ratio and 95% confidence interval were determined using univariate Cox model, and P values were estimated using the log-rank test.

