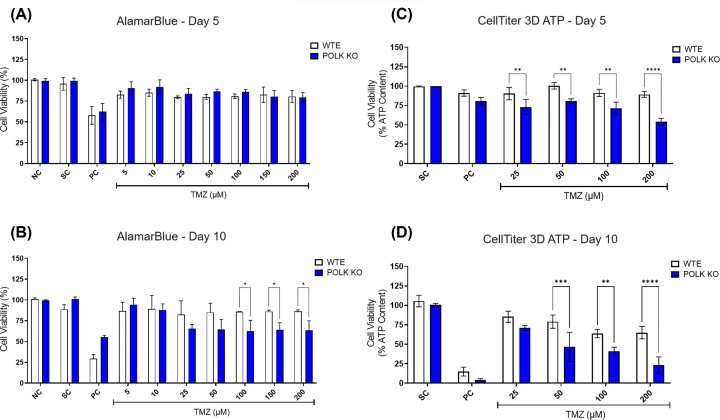
Figure 2. Cell viability assessment in GBM spheroids following TMZ treatment.
(A,B) Cell viability (%) of U251MG WTE and TLS Polκ KO 3D tumor spheroids after exposure with TMZ and their respective controls at Day 5 (A) and Day 10 (B) as assessed by the resazurin assay. (C,D) Cell viability (% ATP Content) of U251MG WTE and TLS Polκ KO tumor spheroids after treatments with TMZ and respective controls at Day 5 (C) and Day 10 (D) as evaluated by CellTiter-Glo 3D ATP cell viability assay. All data were represented as means ± standard deviation (X ± SD) from four spheroids (n=4) per replicate to resazurin and three spheroids (n=3) per replicate to CellTiter-Glo ATP and three independent biological experiments (n=3). *Values statistically different from the WTE cells at the point (date) (*P<0.05, **P<0.01, ***P<0.001, ****P<0.0001; Two-way ANOVA followed by Bonferroni post-test). NC: Negative control (DMEM HG); PC: Positive Control (Cisplatin 100 μM); SC: Solvent Control (1% DMSO); TMZ: Temozolomide.

