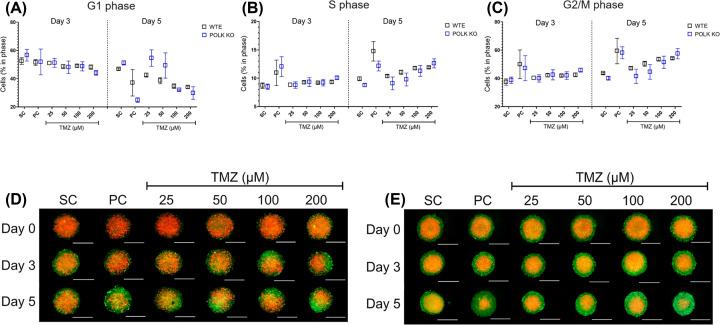
Figure 4. Analysis of cell cycle in GBM spheroids following TMZ treatment.
(A,B) Cell Population (%) in each cell cycle phase in U251MG WTE (A) and TLS Polκ KO (B) 3D tumor spheroids expressing pBOB-EF1-FastFUCCI-Puro plasmid after Day 0, Day 3, and Day 5 of treatments with TMZ and their respective controls. (C,D) Photomicrographs of 3D tumor spheroids of U251MG WTE (C) and TLS Polκ KO (D) tumor spheroids after Day 0, Day 3, and Day 5 of treatment with TMZ and respective controls. All images were obtained by the EVOS XL core microscope using an RFP (red) and FITC (green) channel and using a 10× objective. The acquired images were analyzed and quantified by the software Fiji v. 3.1. Scale: 400 μm (white bar). All data were represented as means ± standard deviation (X ± SD) from four spheroids (n=4) per replicate and three independent biological experiments (n=3). No values statistically different from the WTE cells at the point (date) (Two-way ANOVA followed by Bonferroni post-test). PC: Positive Control (Cisplatin 100 μM); SC: Solvent Control (1% DMSO); TMZ: Temozolomide.

