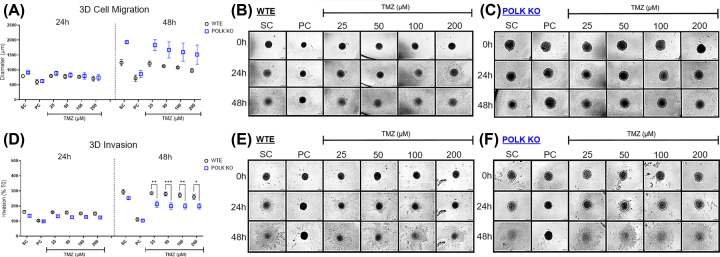
Figure 7. Quantifying metastatic parameters in GBM spheroids following TMZ treatment.
(A) Comparison of diameter increase (µm) covered by U251MG WTE and TLS Polκ KO 3D tumor spheroids after treatments with TMZ and respective controls for 0, 24, and 48 h. The diameter (µm) of migration of the 3D spheroids to the ECM after 24 and 48 h were converted into % to the increase in diameter obtained at 0 h. (B,C) Photomicrographs of U251MG WTE (B) and TLS Polκ KO (C) 3D tumor spheroids in Matrigel® obtained after 0-, 24-, and 48 h of treatment with different TMZ concentrations and their respective controls. The photomicrographs were obtained by the EVOS™ XL microscope using the 10x objective. (D) Comparison of percentage (%) of cell invasion (invadopodia) formed by U251MG WTE and TLS Polκ KO 3D tumor spheroids after treatments with TMZ and its respective controls for 0-, 24- and 48 h. The invasion area (µm3) into the ECM (Matrigel) was converted to % considering the diameter increase of 0 h. (E,F) Photomicrographs of U251MG WTE (E) and TLS Polκ KO (F) 3D tumor spheroids in Matrigel were obtained after 0-, 24-, and 48 h of treatment with TMZ and respective controls. The photomicrographs were obtained by the EVOS™ XL microscope using the 10× objective. The diameter analyses were performed using Zen 3.1 software (Carl Zeiss). Scale bar: 200 μm. All data were represented as means ± standard deviation (X ± SD) from four spheroids (n=4) per replicate and three independent biological experiments (n=3). *Values statistically different from the U251MG WTE cells at the point (date) (*P<0.05, **P<0.01, ***P<0.001, ****P<0.0001; Two-way ANOVA followed by Bonferroni post-test). PC: Positive Control (cisplatin: 100 μM); SC: Solvent Control (1% DMSO); TMZ: Temozolomide.

