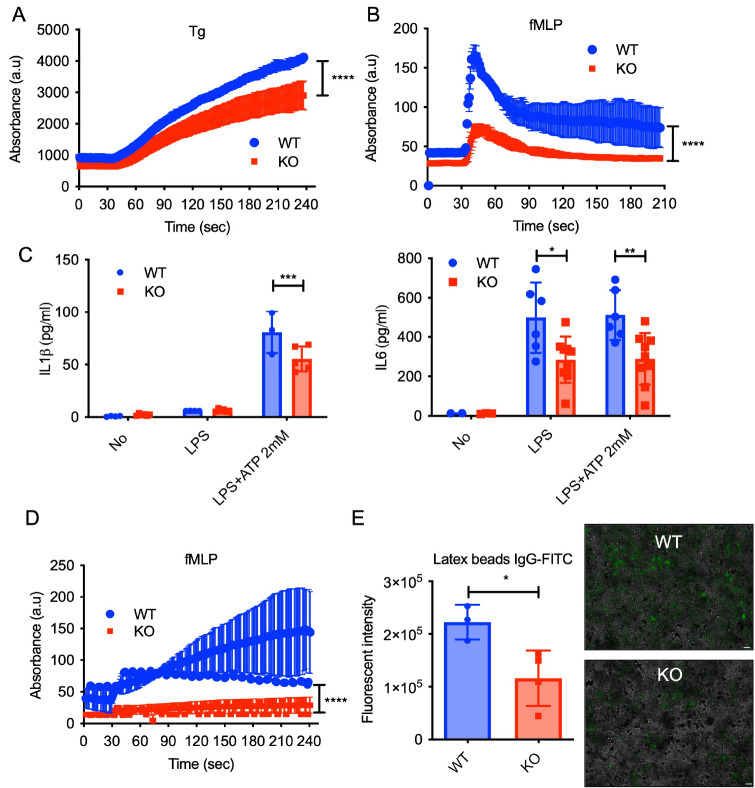
Fig. 2.
Neutrophil dysfunction of Cisd2 KO mice. Calcium influx in blood neutrophils from WT and Cisd2 KO mice measured by flow cytometry over time after (A) thapsigargin (TG; 1 μM) or (B) fMLP (1 μM) treatment. Baseline calcium level was established for 30 sec prior to addition of stimuli. (C) Levels of IL-1β or IL-6 in the cell supernatants of blood neutrophils from WT and Cisd2 KO mice primed with LPS (500 ng/ml) alone for 4 h or further stimulated with ATP (2 mM) for 30 min. Each point represents data from single mouse. (D) ROS in blood neutrophils from WT and Cisd2 KO mice measured by flow cytometry over time after fMLP (1 μM) treatment. Baseline ROS level was established for 30 sec prior to addition of stimuli. (E) Phagocytic activity of blood neutrophils from WT and Cisd2 KO mice using IgG-coated latex beads. Each point represents data from single mouse (left). The fluorescence intensity was read in a fluorescence plate reader at an excitation of 485 nm and an emission of 535 nm. Scale bar, 40 μm. Data are presented as the mean ± SEM. *P = 0.0286 by Student’s t test (right). Representative image of three independent experiments.

