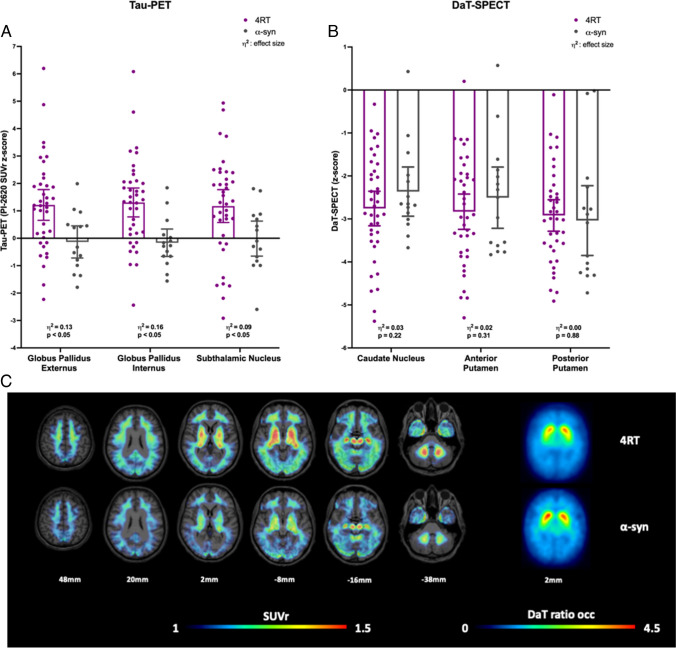
Fig. 1.
Quantitative tau-PET and DaT-SPECT comparison of patients with clinical diagnosis of 4R-tauopathies (4RT) and α-synucleinopathies (α-syn). A Z-score distribution of tau-PET including p-value and effect size η2 in representative brain regions of patients with 4R-tauopathies and patients with α-synucleopathies. SUVr = standardized uptake value ratio. B Z-score distribution of DaT-SPECT including p-value and effect size η2 in comparison of patients with 4R-tauopathies and patients with α-synucleopathies. C Tau-PET SUVr and DaT-SPECT ratio images show the group average of patients with clinically diagnosed 4R-tauopathies and clinically diagnosed α-synucleinopathies

