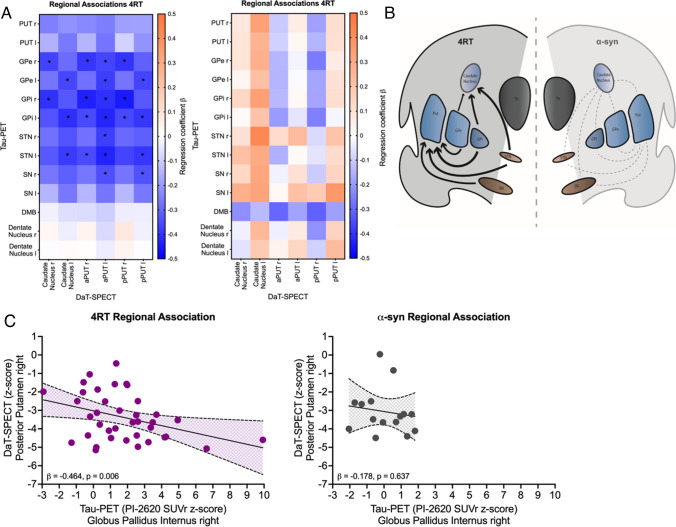
Fig. 2.
Regional associations between tau-PET and DaT-SPECT in patients with 4R-tauopathies (4RT) and α-synucleinopathies (α-syn). A Heat maps show regional associations between tau-PET (y-axis) and DaT-SPECT (x-axis). Significant associations providing a p value < 0.05 are indicated with *. Blue colors indicate negative multiple regression coefficients (β). Orange colors indicate positive multiple regression coefficients (β). Regions analyzed for tau-PET: putamen right, left (PUT r/l), globus pallidus externus right, left (GPe r/l), globus pallidus internus right, left (GPi r/l), subthalamic nucleus right, left (STN r/l), substantia nigra (SN r/l), dorsal midbrain (DMB) and dentate nucleus right, left (Dentate r/l). Regions analyzed for DaT-SPECT: caudate right, left, anterior putamen right, left (aPUT r/l) and posterior putamen right, left (pPUT r/l). B The scheme shows the basic idea of the connection between high tau burden in brain regions involved in direct or indirect pathways of the basal ganglia and striatal dopaminergic loss. Arrow thickness shows the level of correlation of the examined regions for patients with 4R-tauopathies, whereas no significant correlations were found in α-synucleopathies (dashed lines). C Linear correlation between tau burden in the globus pallidus internus and the DaT availability in the posterior putamen of the right hemisphere

