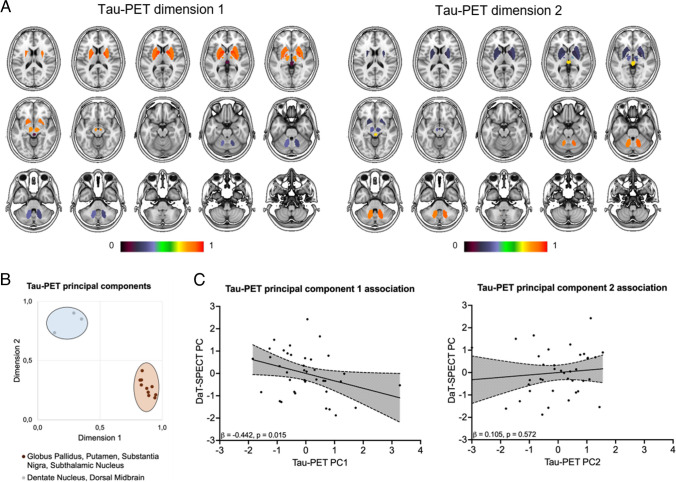
Fig. 3.
Data driven correlation between tau burden and DaT availability. A Visualization of the brain regions resulting from the principal component analysis of tau-PET target regions. The color bar indicates corresponding loading values. Two principal components emerged, consisting of putamen, globus pallidus, subthalamic nucleus and the substantia nigra (principal component 1) as well as dentate nucleus and dorsal midbrain (principal component 2). B Visualized values of the rotated component matrix derived from the principal component analysis. C Tau-PET principal component 1 (tau-PET PC1) indicated a significant negative association with the DaT-SPECT principal component (DaT-SPECT PC), whereas tau-PET principal component 2 (tau-PET PC2) was not associated with the DaT-SPECT PC in a multiple regression model

