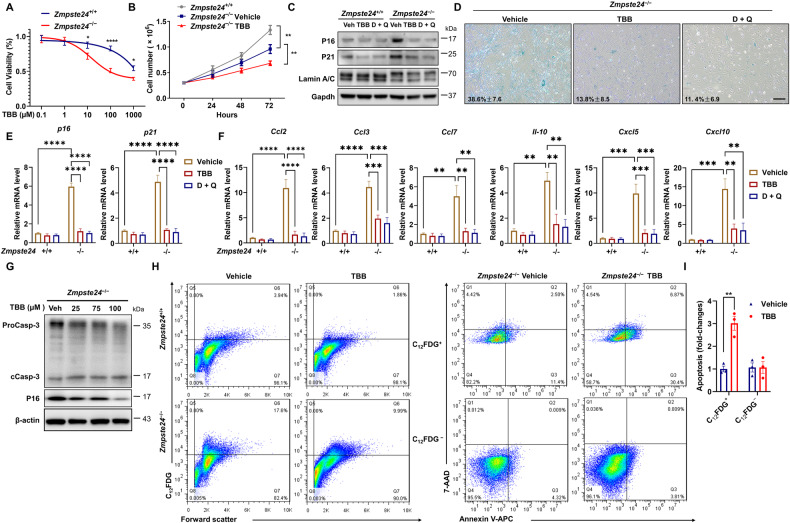
Fig. 2. TBB ameliorates the senescence phenotype by accelerating the apoptosis of senescent cells in Zmpste24-deficient MEFs.
A MEF cells were treated with the indicated amounts of TBB for 24 h. Cell viability was assessed with an MTS assay. B Cell proliferation was measured in Zmpste24−/− MEFs and wild-type littermate controls treated with 75 μM TBB or DMSO (control). C Representative western blot analysis of P16, and P21 in Zmpste24-deficient cells in Zmpste24–/– MEFs and wild-type littermate controls after treatment with vehicle (DMSO), TBB (75 μmol/L) and D + Q (D: 200 nmol/L; Q: 20 μmol/L) at the indicated concentration. D Representative images of SA-β-Gal activity showing blue-stained senescent cells in Zmpste24−/− MEFs treated with 75 μM TBB, D + Q (D: 200 nmol/L; Q: 20 μmol/L) or DMSO (control) at passage 6. Scale bar, 100 μm. E Quantitative RT-PCR analysis of p16 and p21 mRNA levels in Zmpste24−/− and wild-type littermate control after treatment with vehicle (DMSO), TBB (75 μmol/L) and D + Q (D: 200 nmol/L; Q: 20 μmol/L) at the indicated concentration. The data represent the means ± SEM. F Quantitative RT-PCR analysis of SASP genes levels in Zmpste24−/− and wild-type littermate control after treatment with vehicle (DMSO), TBB (75 μmol/L) and D + Q (D: 200 nmol/L; Q: 20 μmol/L) at the indicated concentration. The data represent the means ± SEM. G Representative western blot analysis of proCaspase-3 (ProCasp-3), cleaved caspase-3 (cCasp-3), P16 and β-actin in Zmpste24-deficient cells after treatment with vehicle or TBB at the indicated concentration. H Flow cytometric analysis by Annexin V/7-AAD staining of cell death of senescent Zmpste24−/− MEF cells cultures treated with TBB; Histogram of senescent Zmpste24−/− MEF cells and wild-type littermate controls treated with 75 μM TBB or vehicle only (left). And right is Zmpste24−/− MEF cells are either senescent (C12FDG+; top) or non-senescent (C12FDG−, bottom). Live cells were double negative for 7-AAD and Annexin V (bottom left quadrant), early apoptotic cells were positive for Annexin V (bottom right quadrant), late apoptotic cells were positive for Annexin V and 7-AAD (top left quadrant) and dead cells were positive for 7-AAD only (top right quadrant). I Quantification of flow cytometry data. Apoptosis of senescent and non-senescent cells was calculated by summing up all Annexin V-positive cells. Chart plots mean ± SEM from triplicate experiments, **p < 0.01, two-tailed Student’s t -test.

