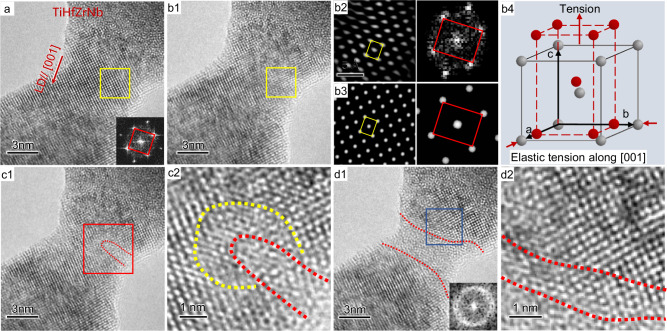
Fig. 1. Elastic strain-induced amorphization in TiHfZrNb samples.
a The initial HEA sample with body-centered cubic (BCC) lattice was stretched along [001]; the inset is a fast Fourier transform (FFT) image corresponding to the yellow squared region. b1, The critical frame before the onset of amorphization. b2 The enlarged view and FFT of the yellow squared region in b1, indicating that the BCC lattice was elastically elongated to a body-centered tetragonal (BCT) lattice. b3, Simulated high-resolution transmission electron microscopy (TEM) image and the FFT pattern corresponding to b2. b4 A schematic image illustrates the lattice deformation. c1 An amorphous nucleus formed in the HEA sample. c2, The enlarged view corresponding to the red squared region in c1, the region outlined by red dotted line is the amorphous nucleus, and the region enclosed by yellow and red dotted lines is the highly distorted lattice in front of the crystal-amorphous interface. d1, An amorphous segment formed in the HEA sample. d2, The enlarged view corresponding to the blue squared region in d1 shows a diffuse interface (outlined by two red dotted lines). LD is the abbreviation of loading direction.

