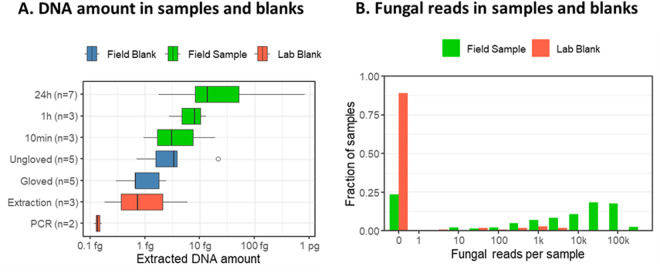
Fig. 2.
Results from field tests and negative controls. Panel A shows DNA concentration in the field test samples based on either 24-hr sampling, 1-hr sampling, or 10-min sampling, as PCR blanks, extraction blanks, and field blanks handled with and without gloves. Panel B shows the distributions of the number of fungal reads per sample based on either field samples (green bars), field blanks (blue bars), or lab blanks (red bars). Note the logarithmic scale in the x-axis.

