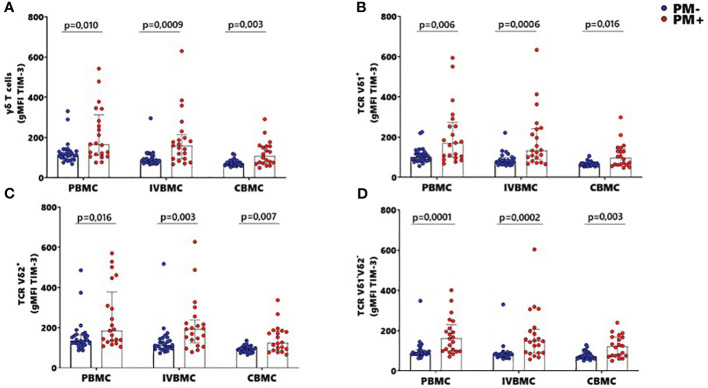
Figure 6.
MFI of TIM-3 within γδ T cells and Vδ1+, Vδ2+, Vδ1-Vδ2- subsets in women at delivery. Mean fluorescence intensity (MFI) of TIM-3 γδ T cells and different subsets were analyzed through multiparametric flow cytometry in PBMC, IVBMC and CBMC of PM- (in blue) and PM+ (in red) women. (A–D) Mean fluorescence intensity of TIM-3 within (A) total TCR γδ+ (B) TCR Vδ1+ (C) TCR Vδ2+ and (D) TCR Vδ1-Vδ2 Mean fluorescence intensities were compared in each group using Mann-Whitney test. PM-, Placental Malaria negative women; PM+, Placental Malaria positive women; PBMC, Peripheral blood mononuclear cell; IVBMC, Intervillous blood mononuclear cell; CBMC, Cord blood mononuclear cell. Each dot represents a single individual.

