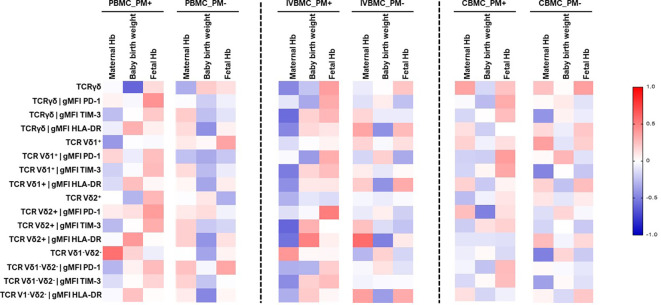
Figure 7.
Heatmap representing the correlation between the γδ T cells phenotype and pregnancy outcomes. The correlation between γδ T cells profile in PBMC, IVBMC, CBMC and pregnancy outcomes was determined using Sperman’s rank Order correlation test. Hb, Hemoglobin level; PM-, Placental Malaria negative women; PM+, Placental Malaria positive women; PBMC, Peripheral blood mononuclear cell; IVBMC, Intervillous blood mononuclear cell; CBMC, Cord blood mononuclear cell.

