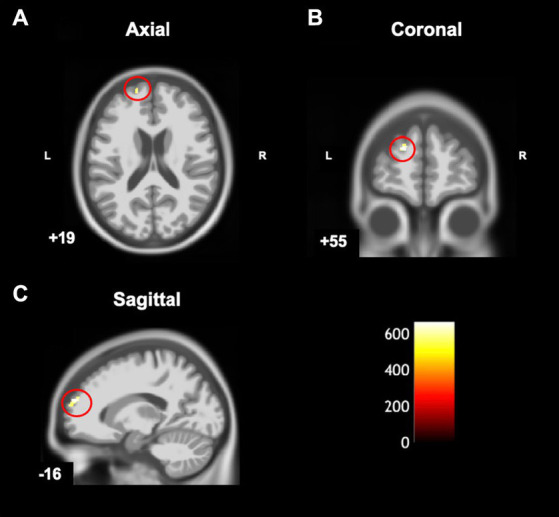
Figure 4.

Statistical parametric map superimposed on CAT T1 IXI555 template shows between-group differences with significantly greater grey matter volume (yellow-white region) in children with developmental coordination disorder in comparison to typically developing children (p < 0.001 uncorrected). Left superior frontal gyrus in (A) Axial; (B) Coronal; and (C) Sagittal view. Color bar shows t-values post threshold-free cluster enhancement analysis.
