
FIGURE 1.
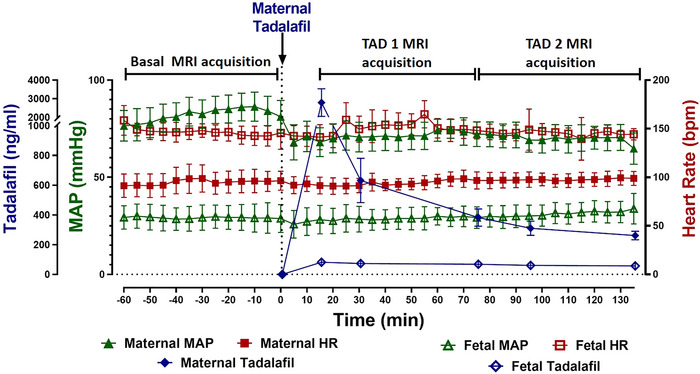
Maternal (filled symbols) and fetal (open symbols) MAP (triangles), HR (squares) and plasma tadalafil concentrations (diamonds) across the basal, TAD 1 and TAD 2 MRI acquisition periods. Maternal MAP is significantly lower during both TAD 1 and TAD 2 periods in comparison to baseline. Data analysed by repeated measures one‐way ANOVA with a Bonferroni correction for multiple comparisons. Data presented as means ± SD. P ≤ 0.05.