
FIGURE 4.
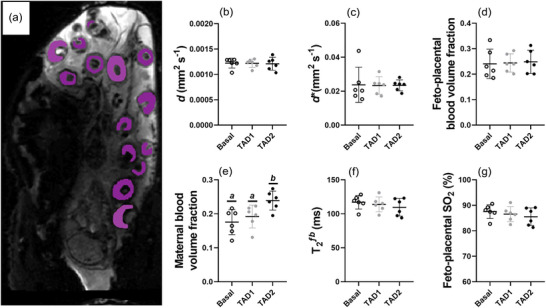
Representative placentome image showing regions of interest for placentome DECIDE (a) and the corresponding diffusivity (b), pseudo‐diffusivity (c), placentome fetal blood volume fraction (d), placentome maternal blood volume fraction (e), T2 of the placentome fetal blood fraction (f) and converted feto‐placental (g) during basal, TAD 1 and TAD 2 periods. Data presented as individual data points with means ± SD superimposed. Data analysed by a repeated measures one‐way ANOVA with Bonferroni's correction for multiple comparisons. Letters represent statistical differences between groups whereby different letters depict statistical significance; *statistically different from baseline P ≤ 0.05.