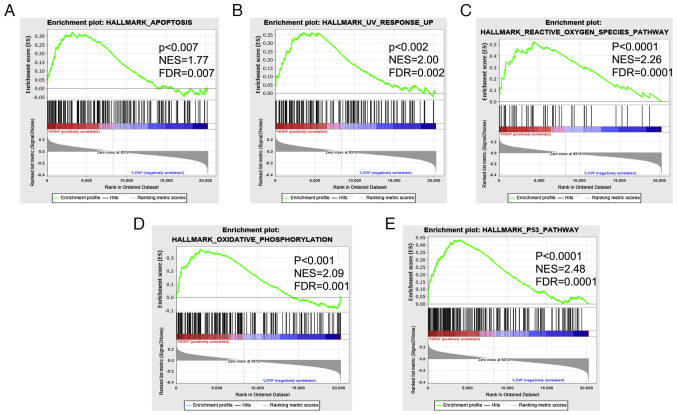
Figure 5.
Gene Set Enrichment Analysis was used to analyze the signaling pathways enriched in patients with esophageal cancer and high miR-185-5p expression: (A) Apoptosis, (B) UV response, (C) reactive oxygen species pathway, (D) oxidative phosphorylation and (E) p53 pathway. NES indicates the extent of enrichment per gene set; FDR indicates the significance of enrichment. Gene sets for enrichment analysis were determined based on adjusted P<0.05 and |NES|>1. NES, normalized enrichment score; FDR, false discovery rate.

