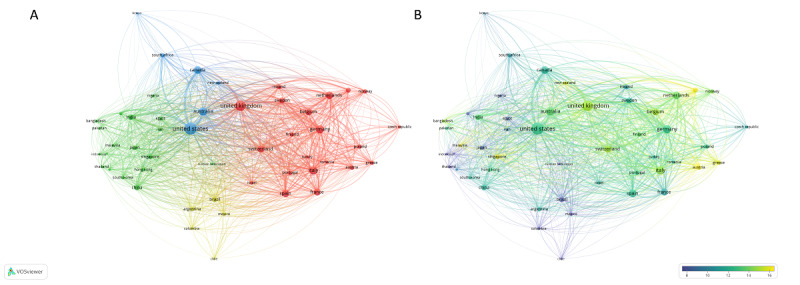
Figure 5.

Collaboration network of the most contributing countries. The graphs show collaborations between the top 50 most contributing countries, weighted by the number of documents. (A) Network visualization representing 4 clusters of countries. (B) Overlay visualization weighted by the number of links and scored by the average number of citations. The figures were prepared using VOSviewer.
