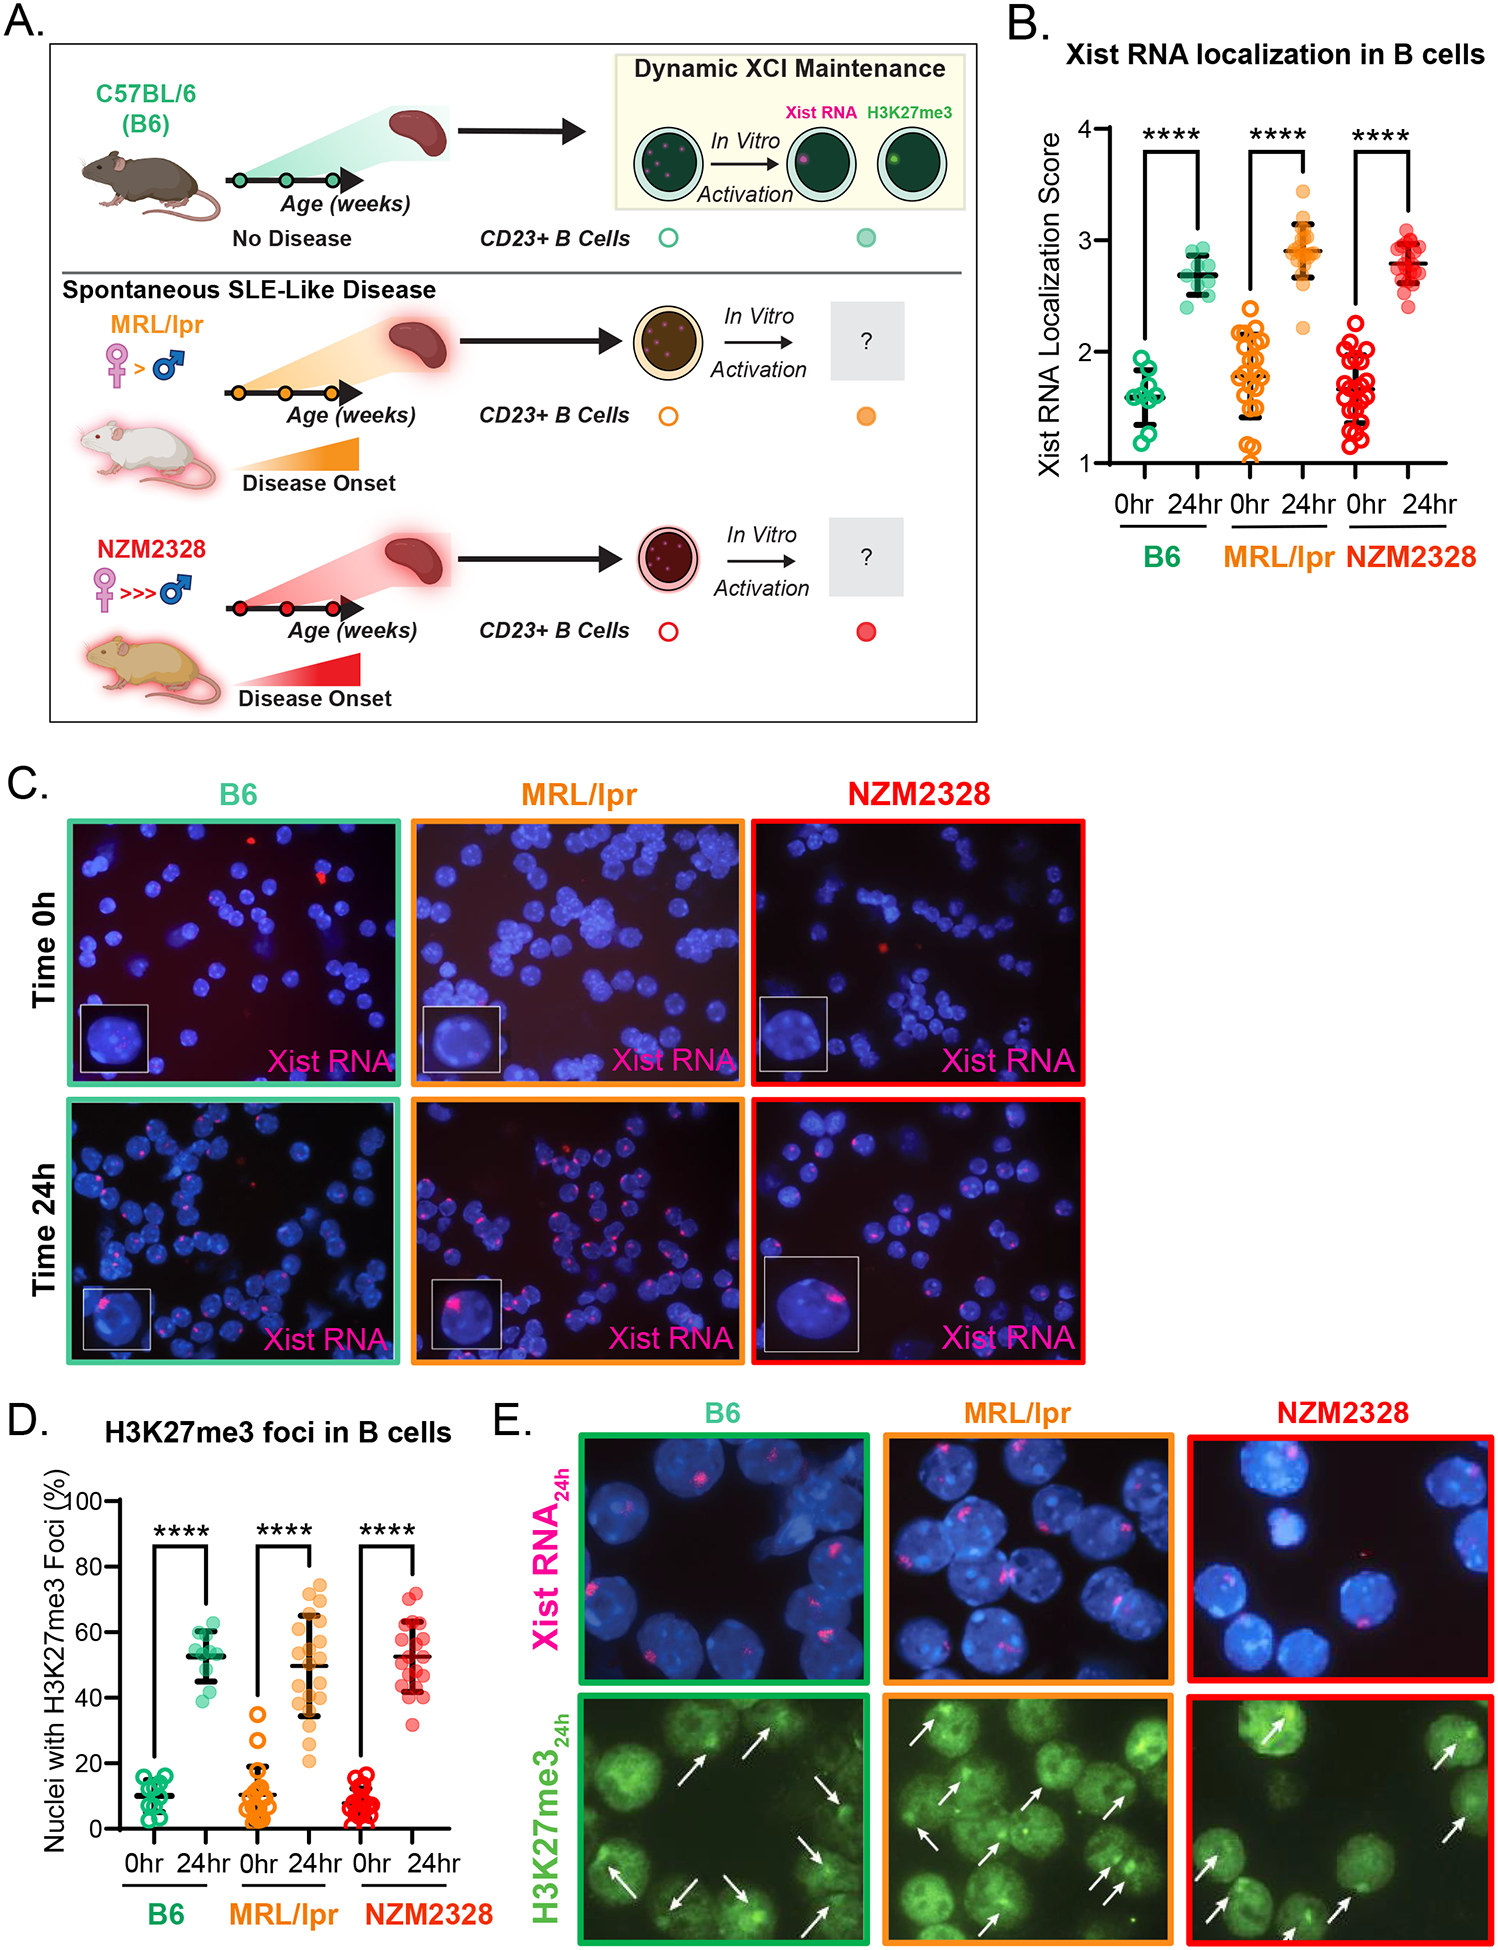
Figure 1. Xist RNA and H3K27me3 localization to the Xi are intact in activated CD23+ B cells from female MRL/lpr and NZM2328 mice.

A. Schematic of the experimental approach. B. Mean Xist RNA localization scores ± SD of non-activated (0hr; open circles) and 24-hour-CpG-activated CD23+ splenic B cells (24hr; filled circles) from 8–31 week-old female C57BL/6 (B6) mice (n=9; teal), female MRL/lpr mice (before and during disease; n=21; orange), and female NZM2328 mice (before and during disease; n=21–22; red). C. Representative Xist RNA FISH images from non-activated (Time 0h) and 24-hour-CpG-activated (Time 24h) CD23+ splenic B cells from female B6 (teal border), female MRL/lpr (orange border), and female NZM2328 mice (red border). D. Mean proportion of nuclei ± SD with H3K27me3 foci from non-activated (0hr; open circles) and 24-hour-CpG-activated (24hr; filled circles) CD23+ splenic B cells from 8–31 week-old female B6 mice (n=10; teal), female MRL/lpr mice (n=18–20; orange), and female NZM2328 mice (n=19; red). E. Representative sequential Xist RNA FISH and H3K27me3 IF images for B6 (teal border), MRL/lpr (orange border), and NZM2328 mice (red border). White arrows depict H3K27me3 foci. * = p < 0.05, ** = p < 0.01, *** = p < 0.001, **** = p < 0.0001.
