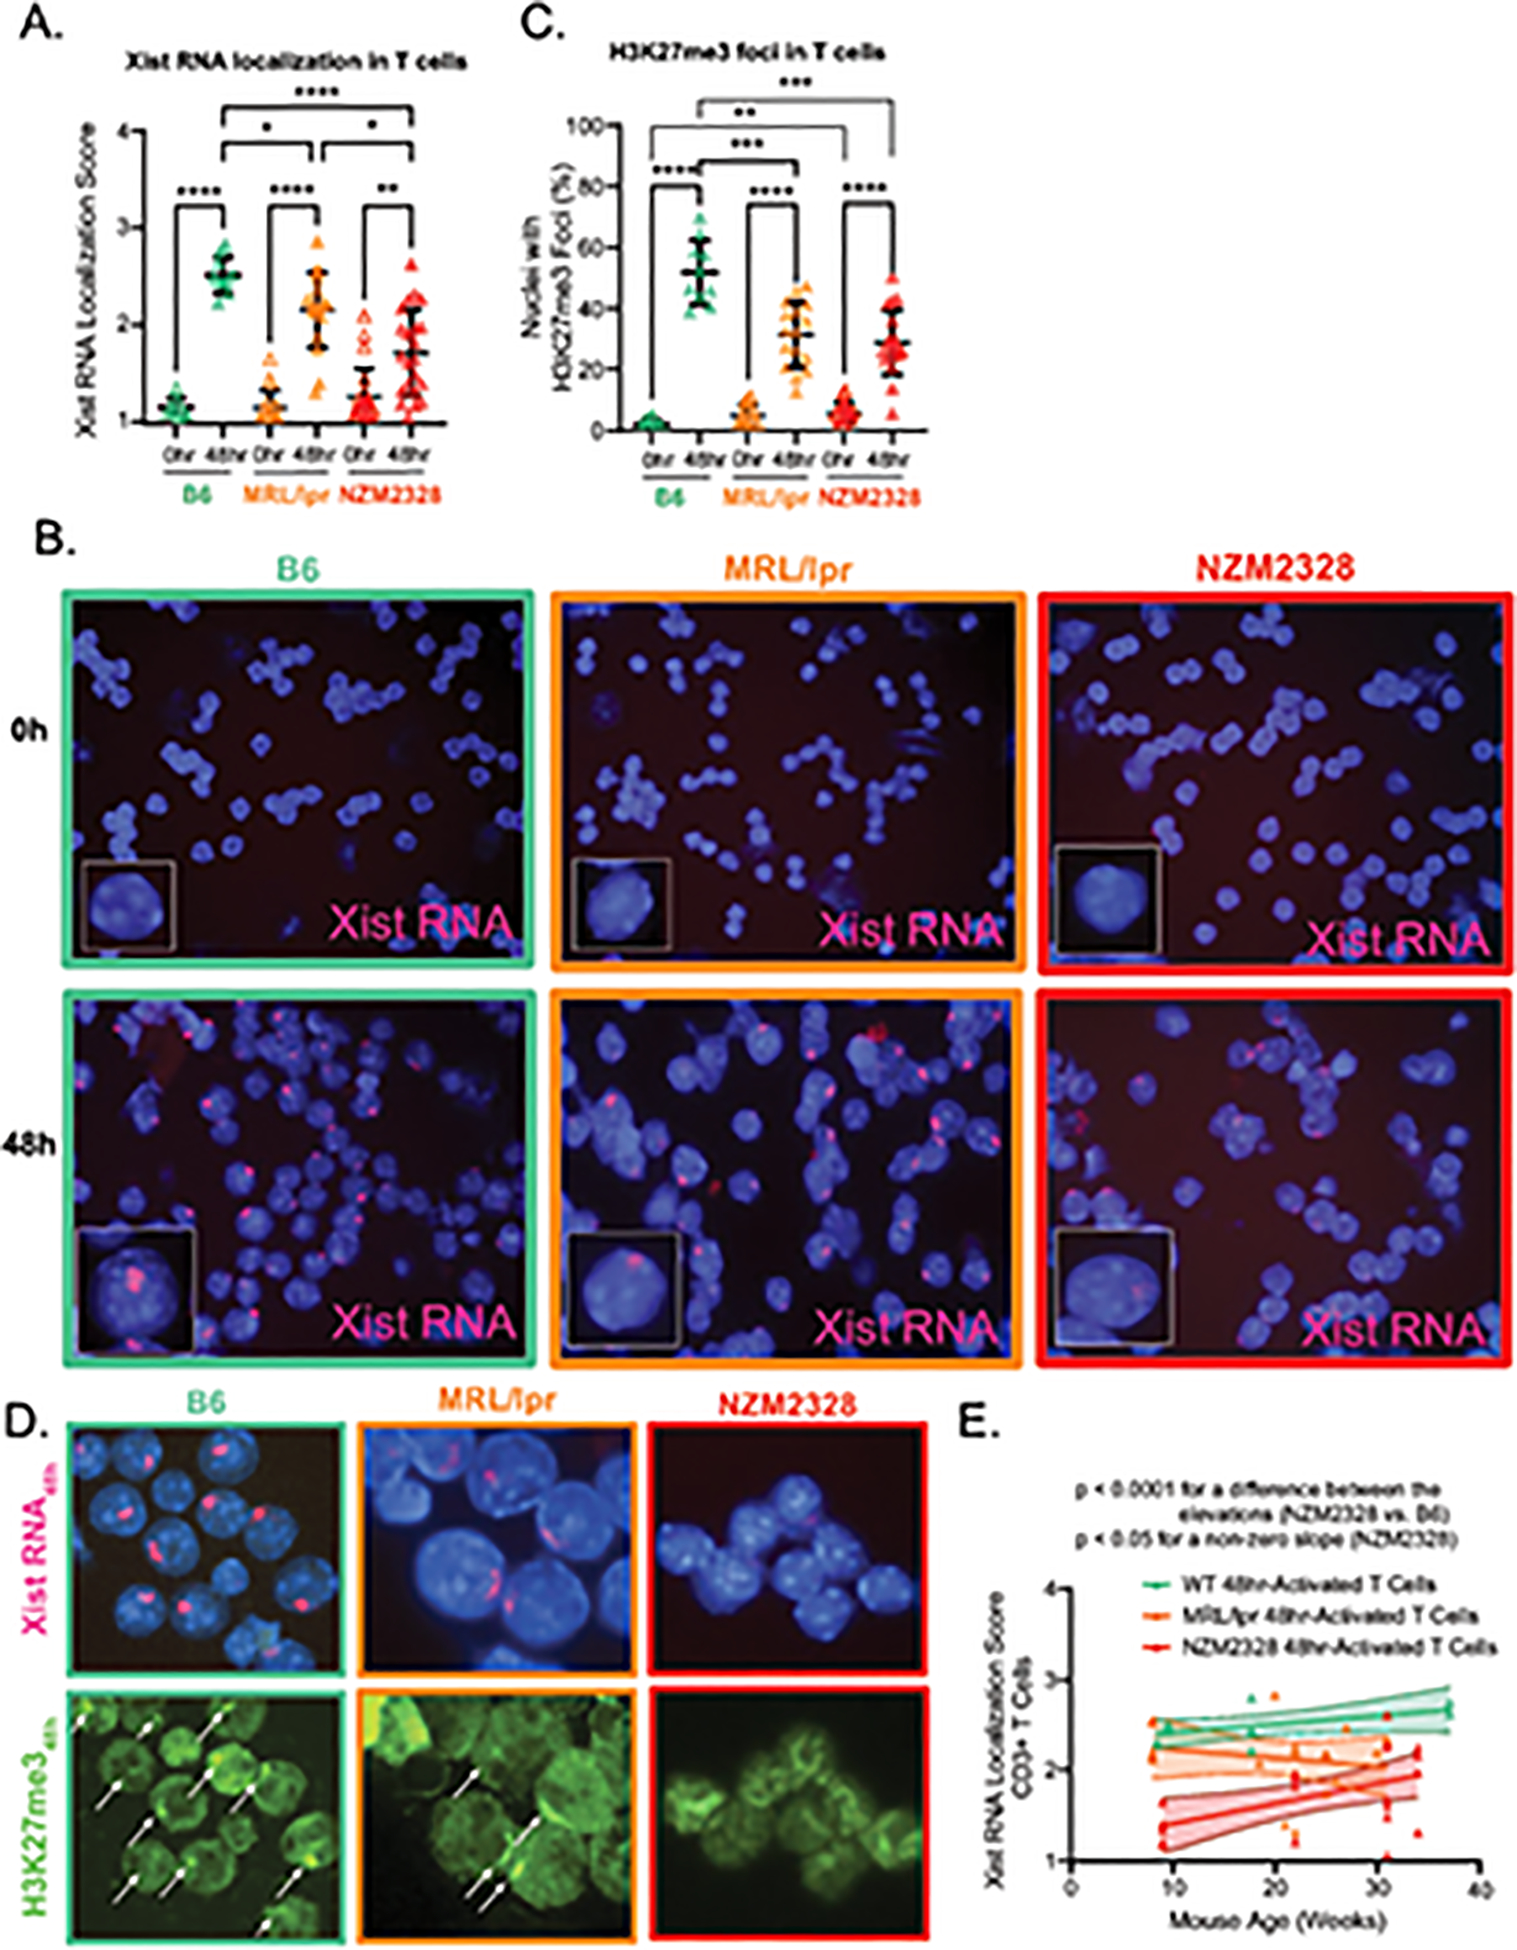
Figure 3. Dynamic localization of Xist RNA and H3K27me3 is impaired in in vitro activated CD3+ T cells from both MRL/lpr and NZM2328 female mice.

A. Mean Xist RNA localization score ± SD of non-activated (0hr; open triangles) and 48-hour-anti-CD3/CD28-activated CD3+ splenic T cells (48hr; filled triangles) from 8–34 week-old age-matched female B6 (n=10; teal), MRL/lpr (n=18; orange), and NZM2328 mice (n=22; red). B. Representative Xist RNA FISH images from non-activated (Time 0h) and 48-hour-anti-CD3/CD28-activated CD3+ splenic T cells (Time 48h) from female B6 (teal border), MRL/lpr (orange border), and NZM2328 mice (red border). C. Mean proportion of nuclei ± SD with H3K27me3 foci from non-activated (0hr; open triangle) and 48-hour-anti-CD3/CD28-activated CD3+ splenic T cells (48hr; filled triangle) from 8–34 week-old female B6 (n=10; teal), MRL/lpr mice (n=16; orange), and NZM2328 mice (n=19; red). D. Representative sequential Xist RNA FISH and H3K27me3 IF images for B6 (teal border), MRL/lpr (orange border), and NZM2328 (red border) mice. Solid arrows depict H3K27me3 foci. E. Linear regression of mouse age (in weeks) versus Xist RNA localization score for each mouse for stimulated CD3+ T cells from female B6 (teal), MRL/lpr (orange), and NZM2328 mice (red), shown with their 95% confidence intervals. * = p < 0.05, ** = p < 0.01, *** = p < 0.001, **** = p < 0.0001.
