. 2024 Mar 6;6(3):e230333. doi: 10.1148/ryai.230333

Figure 2:

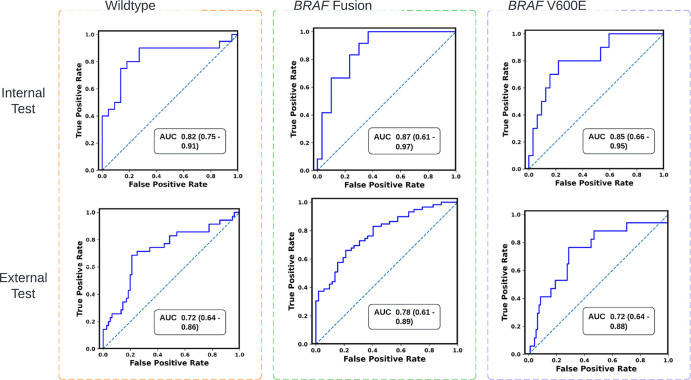
Graphs of receiver operating characteristic curves of the scan-to-prediction pipeline’s predictions for all three molecular subtype classes on internal testing (n = 59) and external testing (n = 112). The models, trained with TransferX, form the individual subtype classifiers. The outputs of the subtype classifiers are pooled using consensus logic, resulting in the pipeline predictions for each mutation class. AUC = area under the receiver operating characteristic curve.

Graphs of receiver operating characteristic curves of the scan-to-prediction pipeline’s predictions for all three molecular subtype classes on internal testing (n = 59) and external testing (n = 112). The models, trained with TransferX, form the individual subtype classifiers. The outputs of the subtype classifiers are pooled using consensus logic, resulting in the pipeline predictions for each mutation class. AUC = area under the receiver operating characteristic curve.