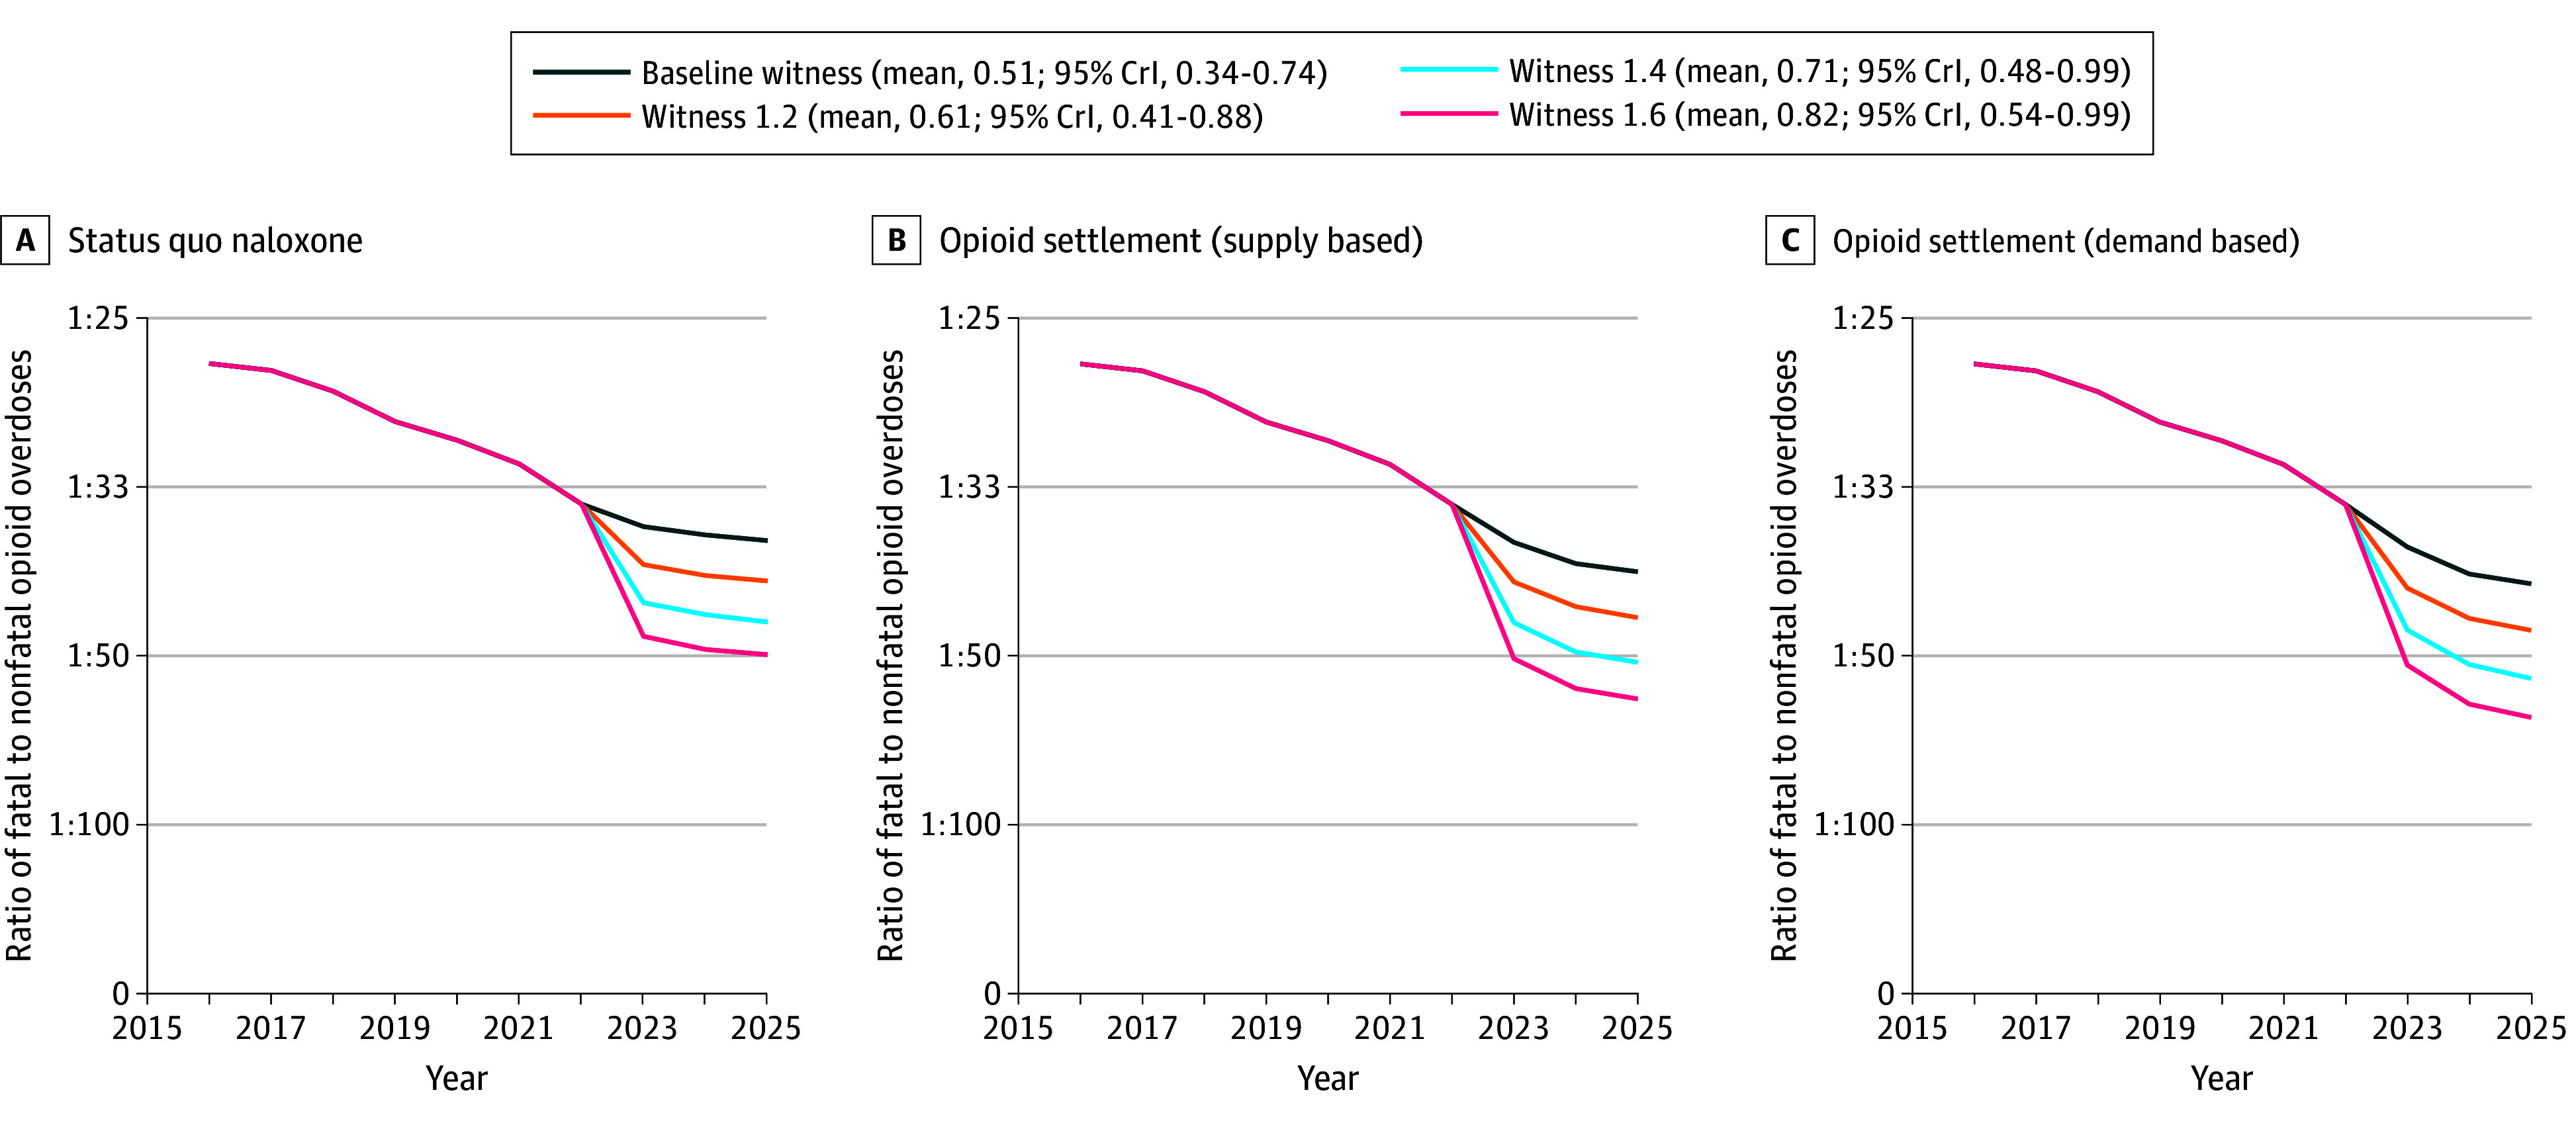
Figure 3. Projected Ratio of Fatal to All Opioid Overdoses in Rhode Island, 2016-2025.

Baseline witness represents the probability of an overdose being witnessed in private or semiprivate settings estimated from model calibration. Levels of witnessed overdoses are represented by the mean and 95% credible interval (CrI) of the calibrated values.
