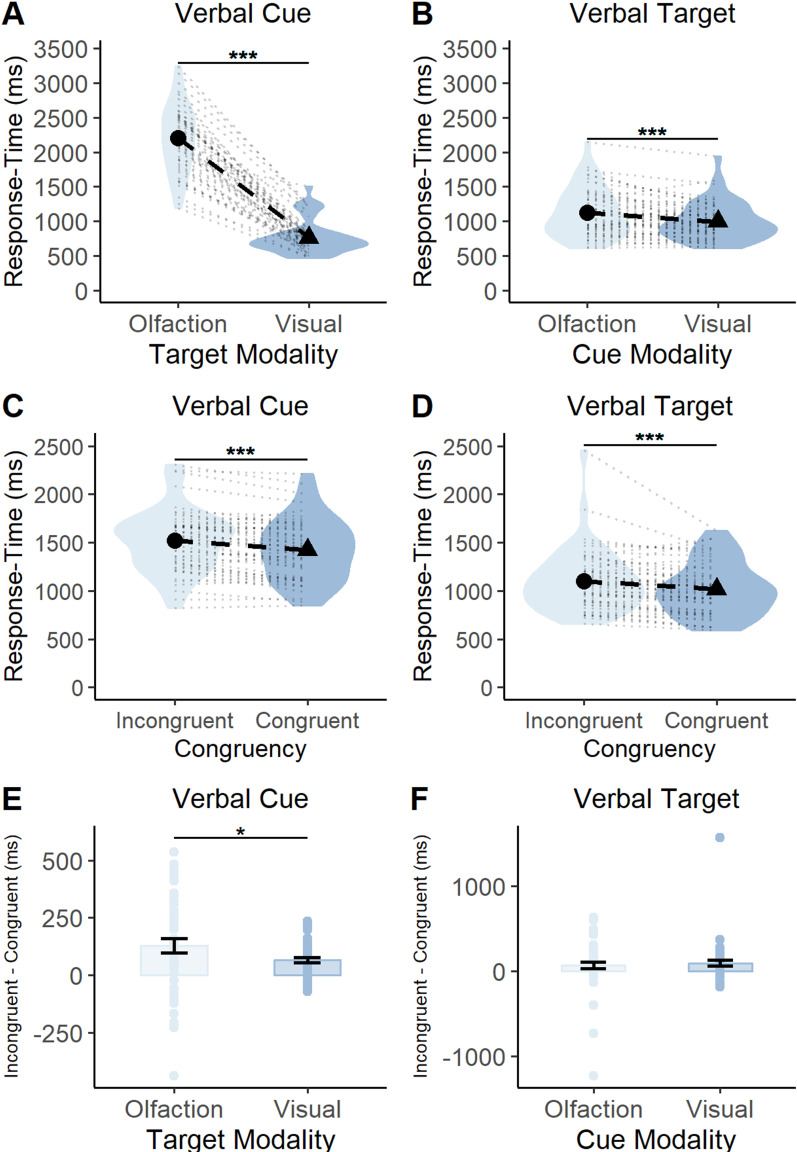
Figure 5.
A, B, Average response time for each modality (olfaction, vision) and block type. A, When targets were preceded by spoken word cues, participants were slower at responding to olfactory targets compared with visual targets. B, When presented with spoken word targets, participants' were slower at responding to said targets when they were preceded by an olfactory cue compared with a visual cue. C, D, Average response time for each congruency type (congruent, incongruent) and block type. C, When targets were preceded by spoken word cues, participants were slower at responding to incongruent targets compared with congruent targets. D, When presented with spoken word targets, participants were slower at responding to said targets when they were preceded by an incongruent cue compared with a congruent cue. Each black circle and triangle in the middle of a violin represents the mean response time for the condition displayed on the x-axis, and each black dotted line shows the magnitude of the difference between the two conditions displayed in a particular plot. The light gray dotted lines surrounding the black dotted line represents a single subjects' response-time difference between the two conditions outlined in a particular plot. The violin represents the density of all the data along the y-axis. Thicker points of the violin represent areas where the data are more clustered and thinner points represent areas where the data are less clustered. E, F, Average response time for interaction. E, When targets were preceded by spoken word cues, the largest disparity between incongruent and congruent response times occurred in the presence of olfactory targets. F, When targets were spoken words, there was no statistically significant difference between incongruent and congruent response times for olfactory and visual cues. Each bar represents the mean response time for a particular condition, and the error bars represent the standard error of the mean. Each dot overlaying the bars represents a particular participants' mean response time. ***p < 0.0001, *p < 0.05.

