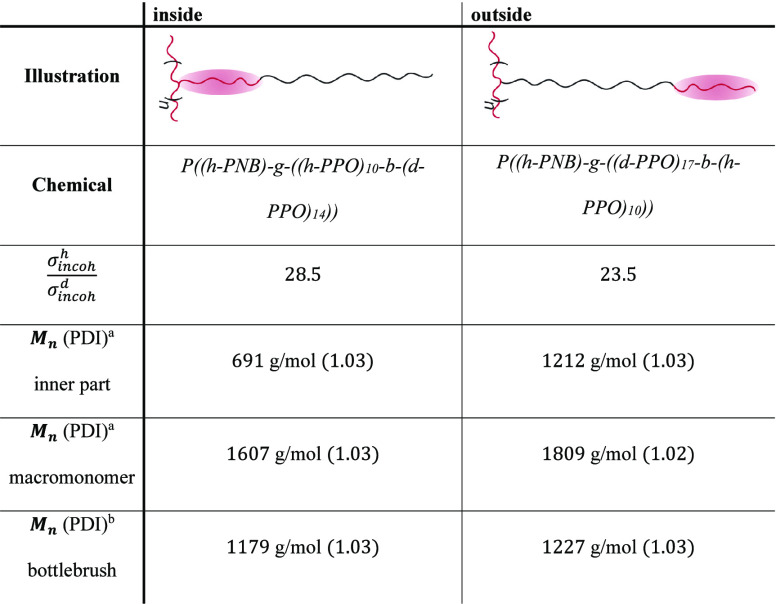
Table 1. Schematic Illustration of the Two Different Samples Together with the Respective Sample Names, the Ratio of σhincoh/σdincoh, Their Number Averaged Molecular Weight, and Dispersity.
Determined by MALDI-TOF.
Determined by GPC. Red color indicates protonated parts, whereas black color indicates deuterated parts.

