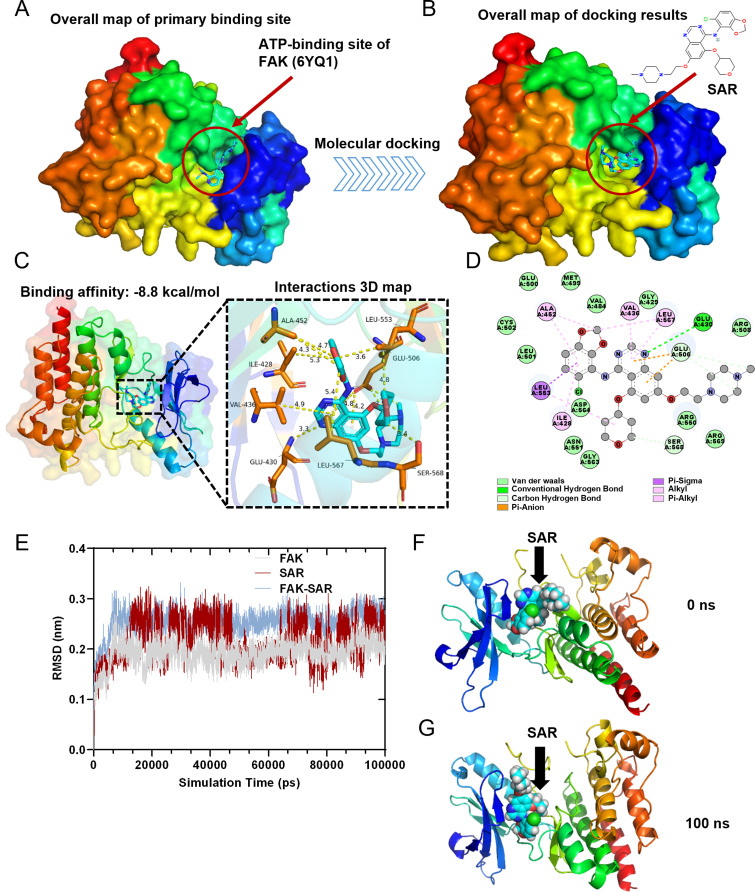
Fig. 3.
Molecular docking analysis and molecular dynamics simulation. (A) The crystal structure of FAK with the ATP-binding site. (B) Simulated docking of SAR inside the crystal structure of FAK. (C) Crystal structure of SAR complexed with FAK. Hydrogen bonds are shown in yellow dashed lines. The residues that can form hydrogen bonds with SAR are shown in yellow. (D) 2D diagram of the binding pose of SAR interacts with FAK. (E) RMSD Plots of RMSD of heavy atoms of FAK (grey), SAR (red), and FAK-SAR complex (blue). (F) Surface presentation of the FAK-SAR complex crystal structure at 0 ns. (G) Surface presentation of the FAK-SAR complex crystal structure at 100 ns.

