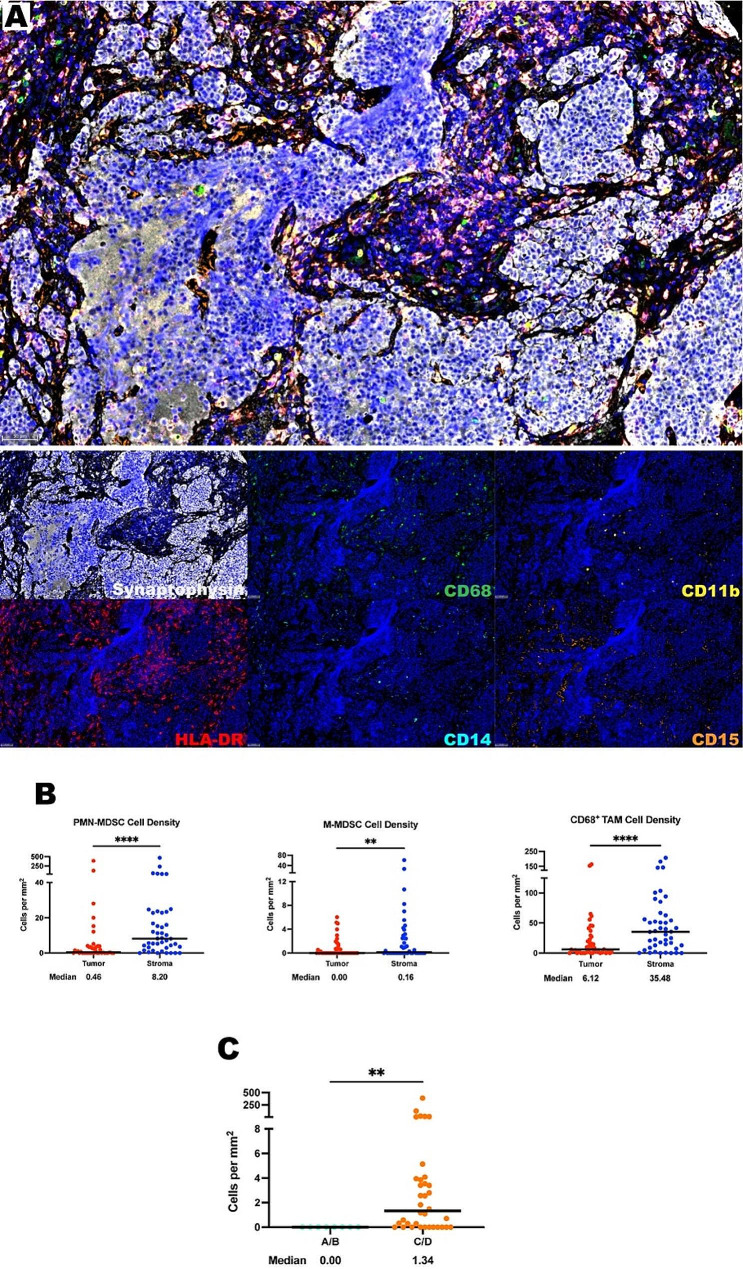
Fig. 2.
Myeloid cells are found in abundance within the ONB TIME, most often within the stroma. (A) Representative photomicrographs at 20x magnification from a low Hyams Grade ONB of merged and single-color immunofluorescence images assessing the presence of myeloid cells with a validated panel of six biomarkers, CD11b (yellow, Opal 570), HLA-DR (red, Opal 690), CD14 (turquoise, Opal 480), CD15 (orange, Opal 620), CD68 (green, Opal 520), and synaptophysin (white, Opal 780). Multispectral immunofluorescence images are counterstained with DAPI. High expression of CD68 identified tumor associated macrophages. Co-localization of CD11b and CD14 without CD15 and little to no HLA-DR identified M-MDSCs. Co-localization of CD11b and CD15 without CD14 and little to no HLA-DR identified PMN-MDSCs. Expression of synaptophysin identified tumor cells. (B) Quantification of PMN-MDSCs, M-MDSCs, and CD68+ TAMs per mm2 in ONB tumor and stroma (n = 44 tumor cores in triplicate). (C) Tumor PMN-MDSC cell density compared by Kadish stage – Low Kadish Stage (A/B) versus High Kadish Stage (C/D). All lines are graphed to indicate the median value. For paired comparisons, Wilcoxon matched-pairs signed rank test and for unpaired comparisons, Mann-Whitney U tests were used to test for statistical significance. **p ≤ 0.01, ****p ≤ 0.0001

