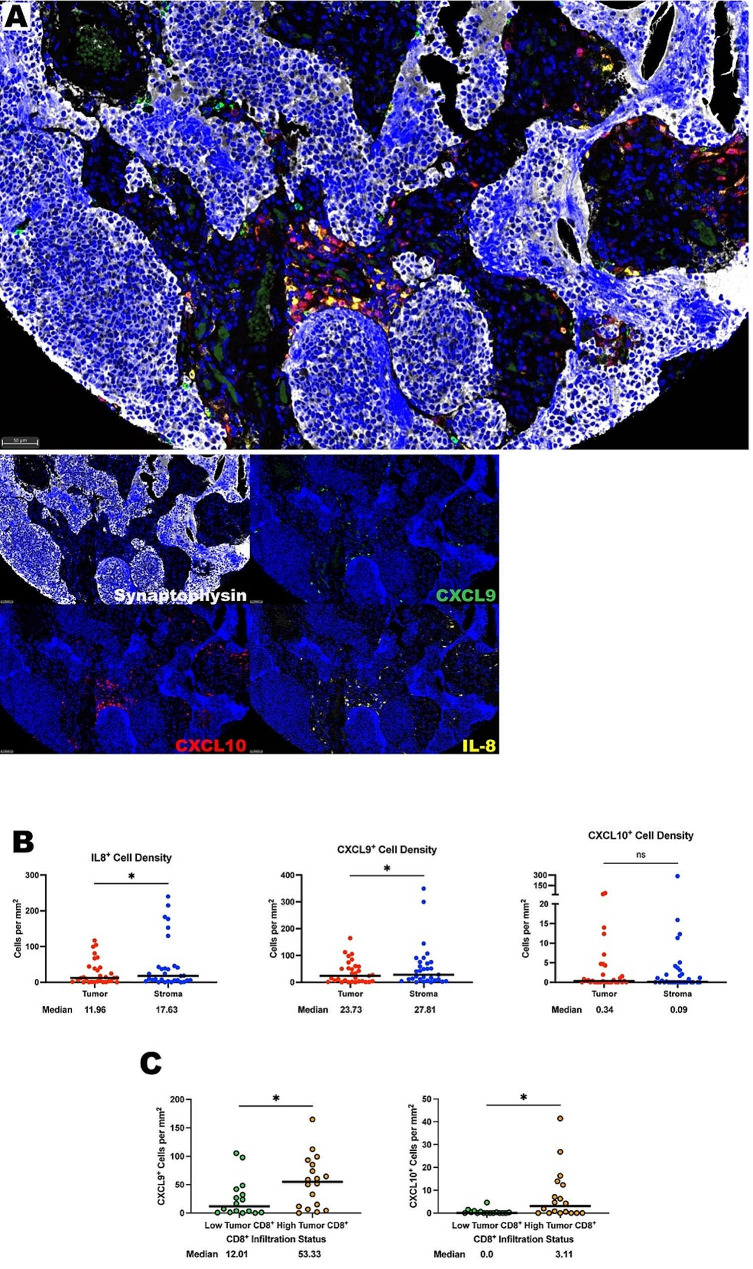
Fig. 5.
IL-8, CXCL-9, and CXCL10 are found in abundance within the olfactory neuroblastoma TIME. (A) Representative photomicrographs at 20x magnification from a low Hyams grade ONB of merged and single-color immunofluorescence images assessing the presence of chemokines with a panel of IL-8 (yellow, Opal 570), CXCL10 (red, Opal 690), CXCL9 (green, Opal 520), and synaptophysin (white, Opal 780). Multispectral immunofluorescence images are counterstained with DAPI. Expression of synaptophysin identified tumor cells, IL-8 identified IL-8+ cells, CXCL9 identified CXCL9+ cells, and CXCL10 identified CXCL10+ cells. (B) Quantification of IL-8+ cells, CXCL9+ cells, and CXCL10+ cells per mm2 in ONB tumor and stroma (n = 32 tumor cores in triplicate). (C) Quantification of CXCL9+ and CXCL10+ cells in the tumor compartment by CD8+ tumor infiltration status. All lines are graphed to indicate the median value. For paired comparisons, Wilcoxon matched-pairs signed rank test and for unpaired comparisons, Mann-Whitney U tests were used to test for statistical significance. *p ≤ 0.05, ns, non-significant

