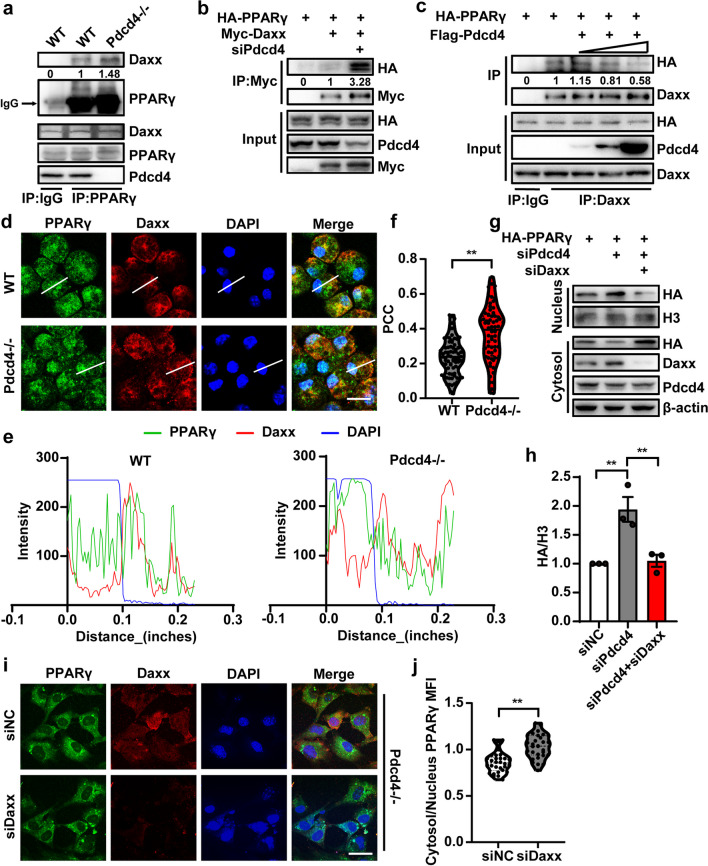
Fig. 5.
Pdcd4 inhibits PPARγ nuclear expression through interrupting the interaction between PPARγ and Daxx. a The PFC of WT or Pdcd4−/− mice was lysis with Immunoprecipitation buffer. Immunoprecipitation was performed with the anti-PPARγ antibody. Immunoblotting was performed with anti-Daxx or anti-PPARγ antibody. b HEK293 cells were co-transfected with HA-PPARγ, Myc-Daxx and si Pdcd4. Immunoprecipitation was performed with the anti-Myc antibody. Immunoblotting was performed with anti-Myc or anti-HA antibody. c HEK293 cells were co-transfected with HA-PPARγ and Flag-Pdcd4. Immunoprecipitation was performed with the anti-Daxx antibody. Immunoblotting was performed with anti-Daxx or anti-HA antibody. d–f Confocal picture showed the immunofluorescence of PPARγ (Green) and Daxx (Red) in the peritoneal macrophages of WT or Pdcd4−/− mice; scale bar 20 μm. The co-localized index (Pearson Correlation Coefficient: PCC) was calculated from n > 30 cells. The value of PCC is between − 1 and 1. 1 represents complete positive correlation, − 1 represents complete negative correlation, and 0 represents random relationship (protein A and protein B are randomly distributed and have no correlation). Scale bar 20 μm. Unpaired two-tailed Student’s t test, **P < 0.01. g, h Nuclear and cytoplasmic proteins were isolated from the HA-PPARγ, siPdcd4 and siDaxx-transfected HEK293 cells, and determined by SDS-PAGE. N = 3, one-way ANOVA and Tukey’s multiple comparisons test (F2,6 = 14.78, P < 0.01), **P < 0.01. i, j siNC or siDaxx was transfected into MEFs from Pdcd4−/− mice for 24 h, and the localization of PPARγ was observed by immunofluorescence, and the mean fluorescence intensity of PPARγ was quantified from n > 30 cells; scale bar 20 μm. Unpaired two-tailed Student’s t test, **P < 0.01. The figures represent three independent experiments that yield similar result

