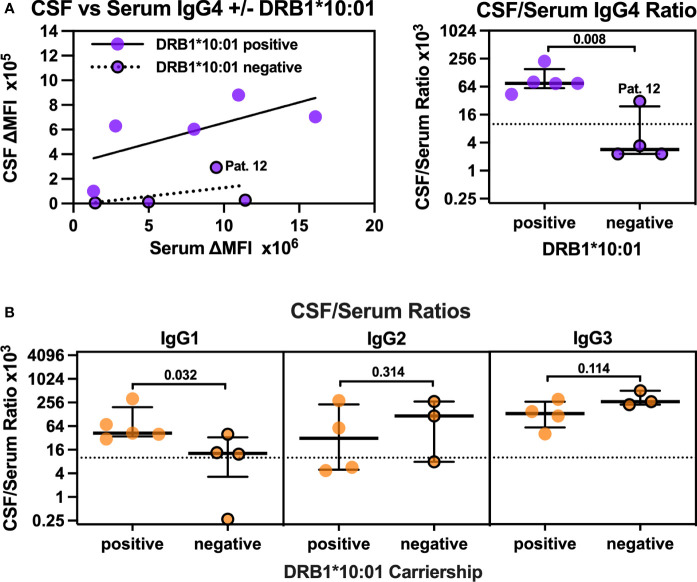
Figure 3.
CSF/Serum ratios for anti-IgLON5 IgG4 but also IgG1 are higher in DRB1*10:01 carriers compared to non-carriers. (A, left panel) The mean fluorescence intensity above background (ΔMFI) for anti-IgLON5 IgG4 in CSF was plotted against serum anti-IgLON5 IgG4 ΔMFI separatedly for DRB1*10:01 carriers (circles without borders) and non-carriers (circles with black borders). The results of linear regression (carriers: R2 = 0.47, p = 0.1984, non-carriers R2 0.21, p = 0.5466) and the non-carrier with the higher CSF/serum ratio (patient 12) are indicated. (A, right panel, B): CSF/serum ratios for anti-IgLON4 IgG4 (A, right panel), IgG1–3 (B) of DRB1*10:01 carriers compared to non-carriers. Statistical analysis in the right panel of (A, B) was performed using one-sided Mann–Whitney U tests. The p-values are indicated. A comparison of anti-IgLON5 IgG4 CSF/serum ratios in association with of DRB1*10:01 and DQB1*05:01 carriership can be found in Supplementary Figure S13.

