Figure 2.

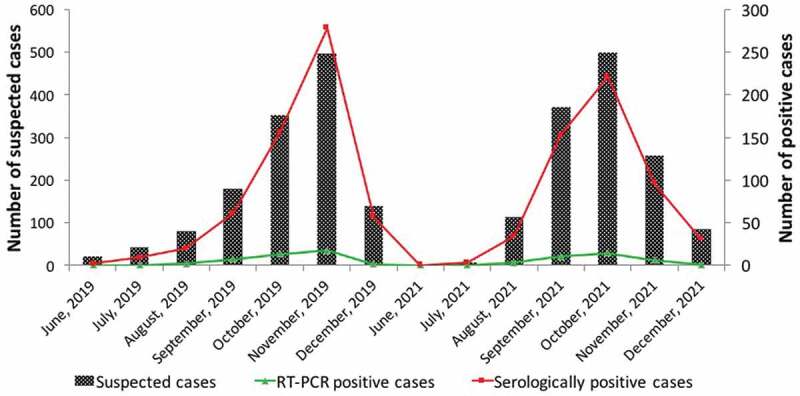
Temporal distribution of dengue cases during the 2019 and 2021 outbreak. X-axis represents the month and year of the outbreak, Y-axis represents the number of suspected cases, secondary axis represents the number of positive cases.

Temporal distribution of dengue cases during the 2019 and 2021 outbreak. X-axis represents the month and year of the outbreak, Y-axis represents the number of suspected cases, secondary axis represents the number of positive cases.