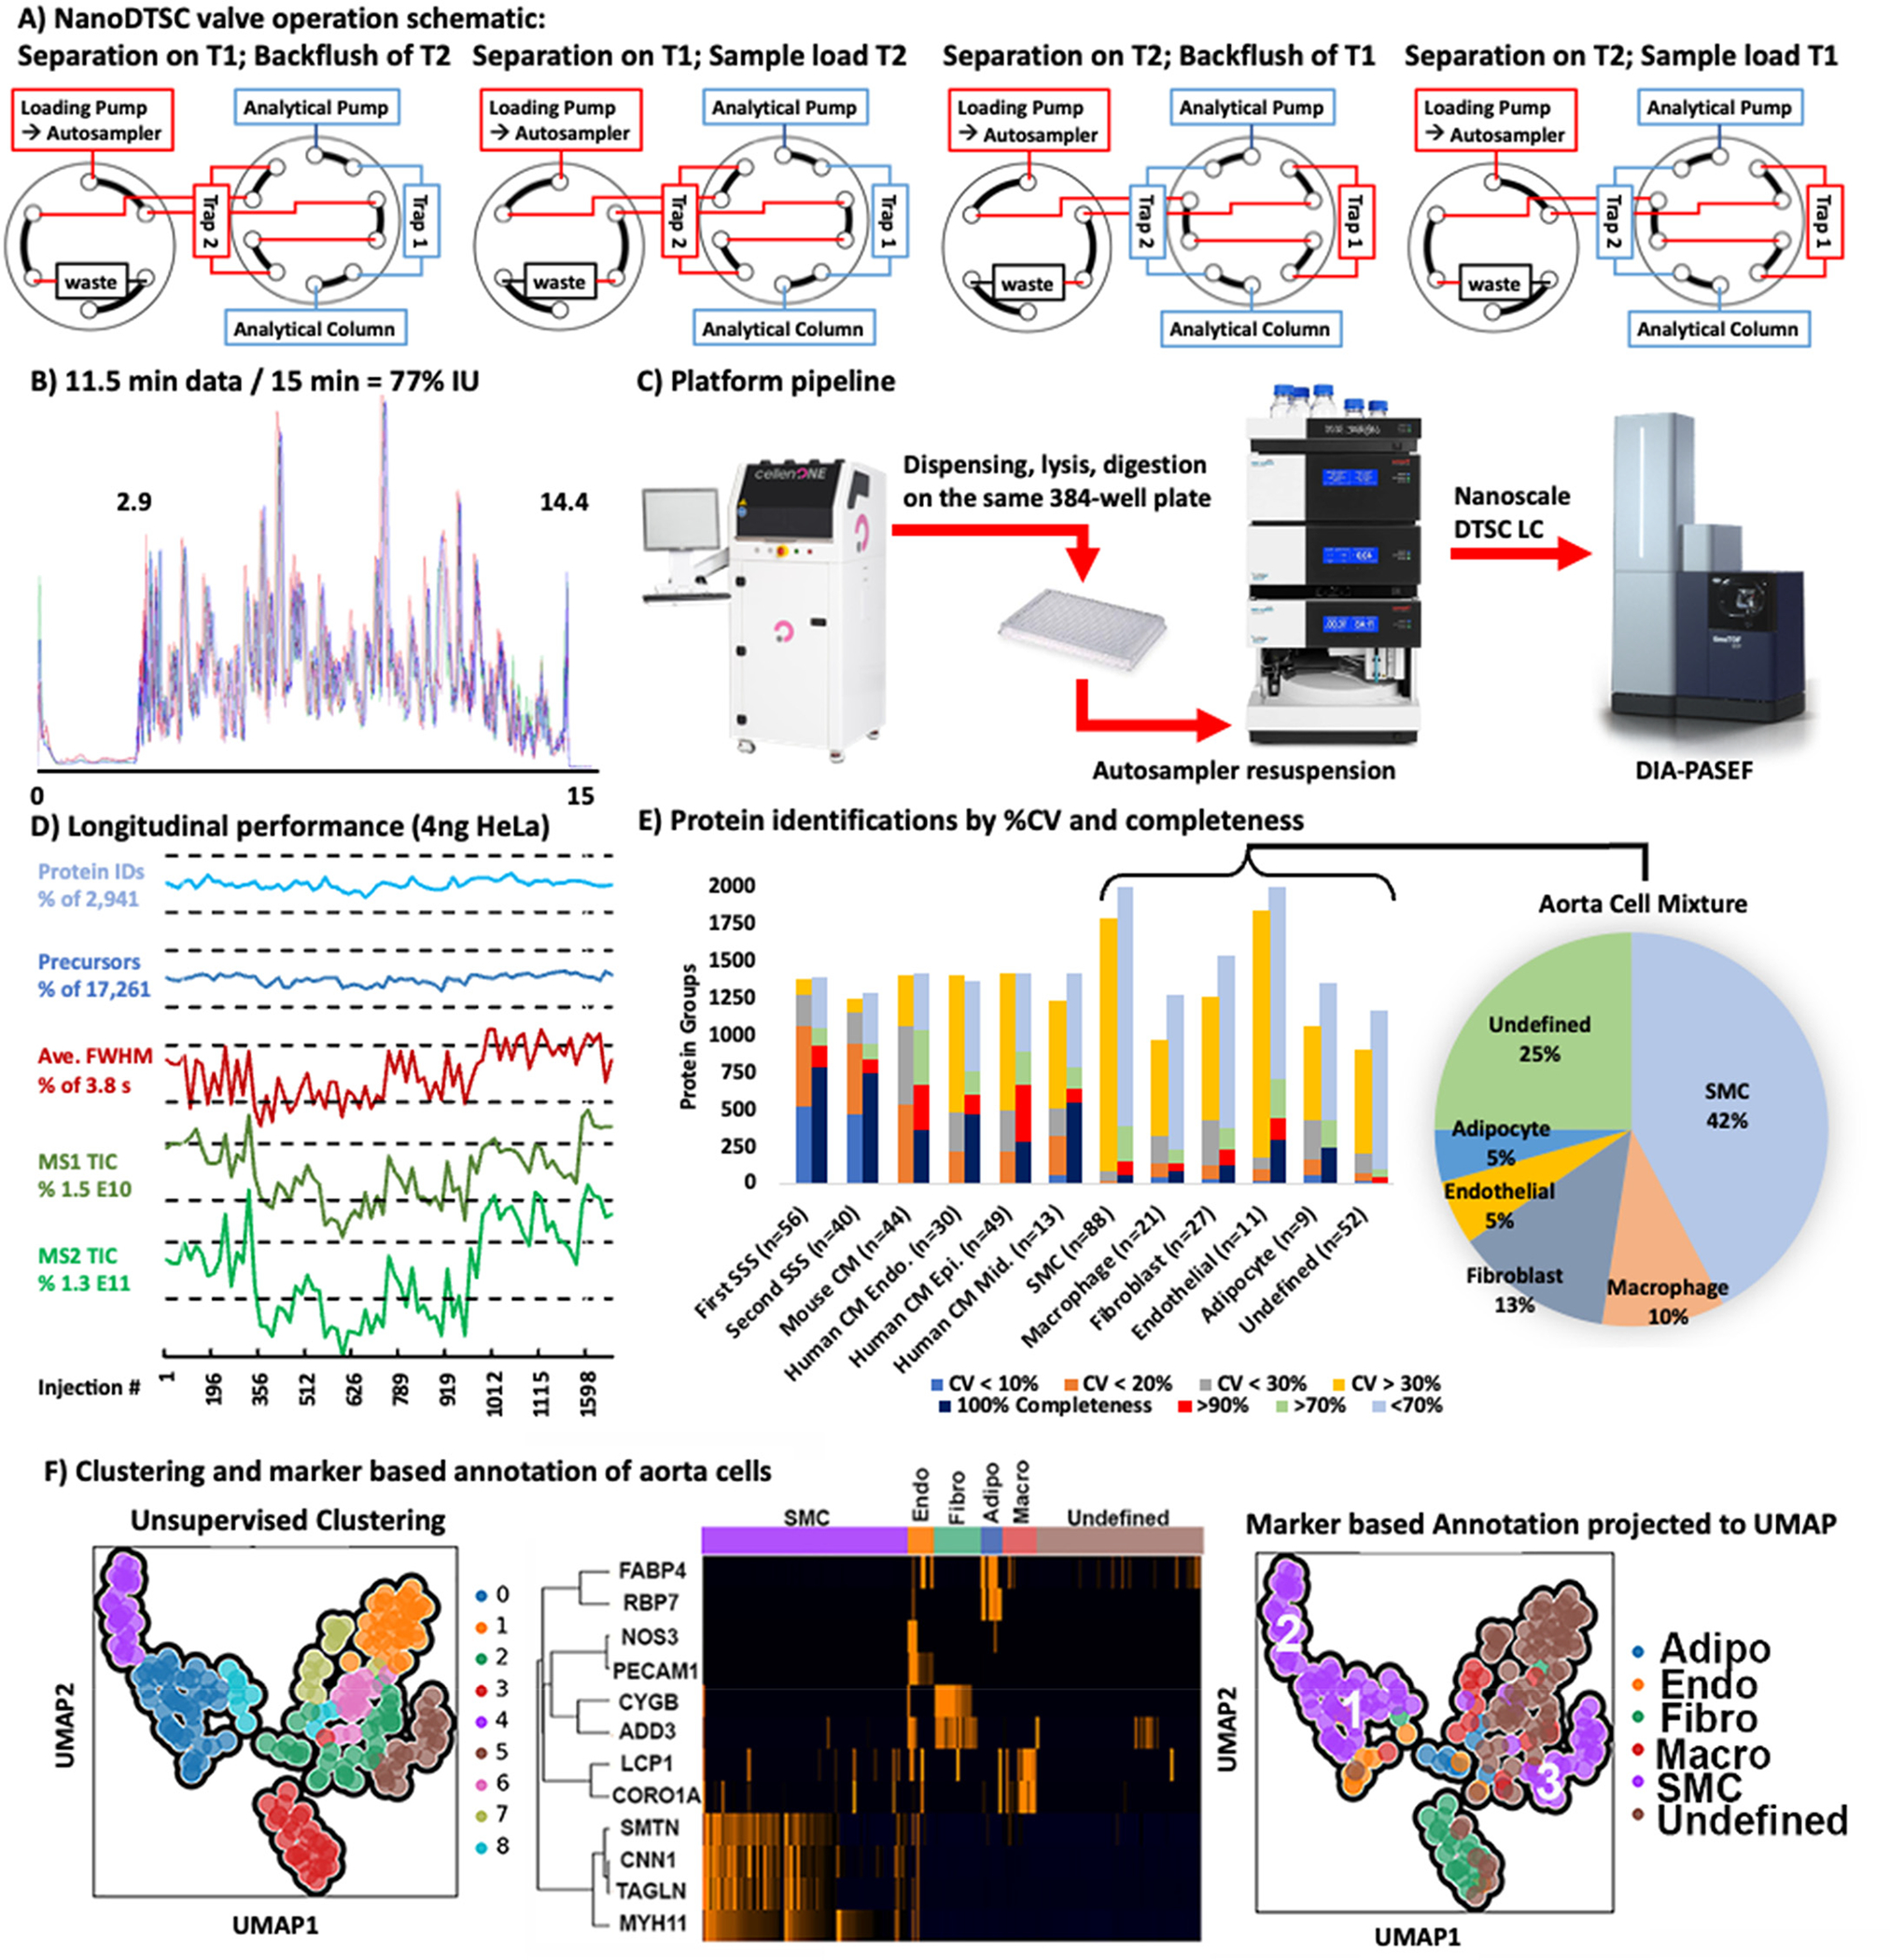
Figure 1.

(A) Valve schematic of the two methods used in nanoDTSC: blue represents the analytical separation path, and red represents the path of loading pump flow used for cleaning, equilibration, and sample loading. (B) Overlay of 4-SSS runs, peptides elution 2.9–14.4 min (77% instrument utilization). (C) Workflow overview: Individual cells are dispensed by CellenOne into 384-well plate, digested, resuspended by the autosampler, and analyzed by DIA-PASEF. (D) Consistent system performance over 1700 injections monitored by HeLa QC, dashed lines represent 10% deviation from average. (E) Protein quantitative reproducibility with color coded %CV ranges (blue <10%, orange <20%, gray <30%, yellow >30%) and color coded data completeness (dark blue detected in every sample, red >90% of samples, light green >70% of samples, gray <70% of samples) for each sample type analyzed. The distribution of annotated cells from the aorta is represented as a pie chart with smooth muscle cells comprising the largest group. (F) Unsupervised UMAP clustering of aorta cells by entire proteome (left), clustering by cell-type markers (middle), and projection of cell type annotation unto the UMAP plot (right).
