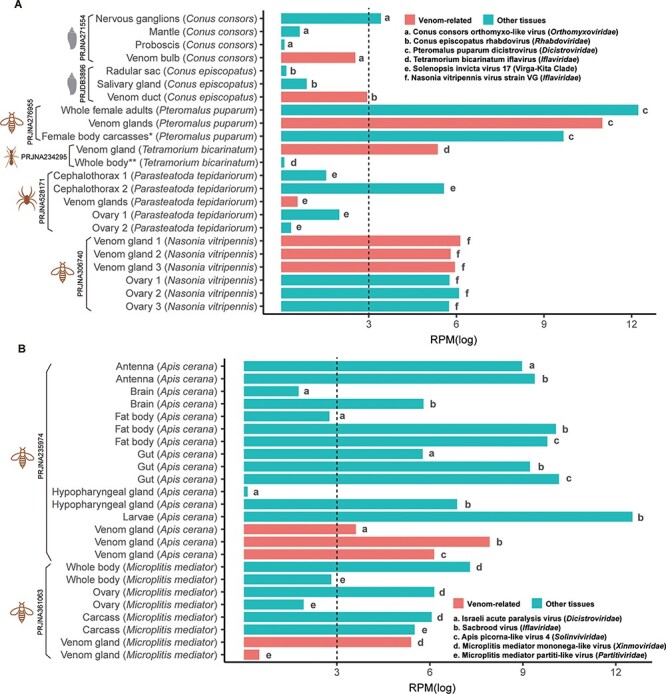
Figure 6.

Comparison of the abundance of the RNA viruses from the venom-related microenvironment and other tissues. The SRA files of other tissues were retrieved from the same Bioproject as the venom data. The abundance of the RNA viruses from different tissues was calculated as RPM based on the non-rRNA reads. For visualization and comparison, the RPM values were normalized with log. (A) Only one RNA virus was identified from each host. (B) Multiple RNA viruses were identified from one host. * Female body carcasses without venom apparatus, ** Whole body without abdomen.
